
Latest recommendations

| Id | Title | Authors | Abstract▼ | Picture | Thematic fields | Recommender | Reviewers | Submission date | |
|---|---|---|---|---|---|---|---|---|---|
09 Sep 2020
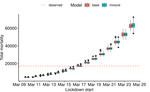
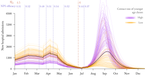
Bayesian investigation of SARS-CoV-2-related mortality in FranceModeling the effect of lockdown and other events on the dynamics of SARS-CoV-2 in FranceRecommended by Valery Forbes based on reviews by Wayne Landis and 1 anonymous reviewerThis study [1] used Bayesian models of the number of deaths through time across different regions of France to explore the effects of lockdown and other events (i.e., holding elections) on the dynamics of the SARS-CoV-2 epidemic. The models accurately predicted the number of deaths 2 to 3 weeks in advance, and results were similar to other recent models using different structure and input data. Viral reproduction numbers were not found to be different between weekends and week days, and there was no evidence that holding elections affected the number of deaths directly. However, exploring different scenarios of the timing of the lockdown showed that this had a substantial impact on the number of deaths. This is an interesting and important paper that can inform adaptive management strategies for controlling the spread of this virus, not just in France, but in other geographic areas. For example, the results found that there was a lag period between a change in management strategies (lockdown, social distancing, and the relaxing of controls) and the observed change in mortality. Also, there was a large variation in the impact of mitigation measures on the viral reproduction number depending on region, with lockdown being slightly more effective in denser regions. The authors provide an extensive amount of additional data and code as supplemental material, which increase the value of this contribution to the rapidly growing literature on SARS-CoV-2. References [1] Duchemin, L., Veber, P. and Boussau, B. (2020) Bayesian investigation of SARS-CoV-2-related mortality in France. medRxiv 2020.06.09.20126862, ver. 5 peer-reviewed and recommended by PCI Mathematical & Computational Biology. doi: 10.1101/2020.06.09.20126862 | Bayesian investigation of SARS-CoV-2-related mortality in France | Louis Duchemin, Philippe Veber, Bastien Boussau | <p>The SARS-CoV-2 epidemic in France has focused a lot of attention as it hashad one of the largest death tolls in Europe. It provides an opportunity to examine the effect of the lockdown and of other events on the dynamics of the epidemic. In par... | | Probability and statistics | Valery Forbes | 2020-07-08 17:29:46 | ||
19 Sep 2022
HMMploidy: inference of ploidy levels from short-read sequencing dataDetecting variation in ploidy within and between genomesRecommended by Alan Rogers based on reviews by Barbara Holland, Benjamin Peter and Nicolas Galtier based on reviews by Barbara Holland, Benjamin Peter and Nicolas Galtier
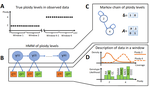
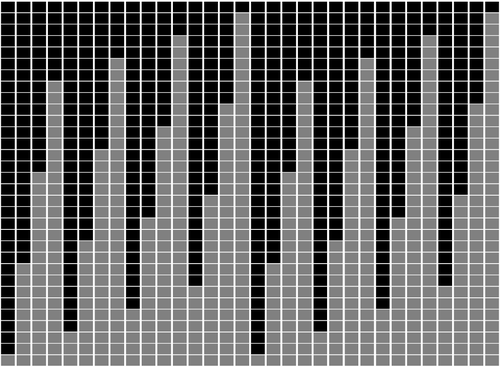
Soraggi et al. [2] describe HMMploidy, a statistical method that takes DNA sequencing data as input and uses a hidden Markov model to estimate ploidy. The method allows ploidy to vary not only between individuals, but also between and even within chromosomes. This allows the method to detect aneuploidy and also chromosomal regions in which multiple paralogous loci have been mistakenly assembled on top of one another. HMMploidy estimates genotypes and ploidy simultaneously, with a separate estimate for each genome. The genome is divided into a series of non-overlapping windows (typically 100), and HMMploidy provides a separate estimate of ploidy within each window of each genome. The method is thus estimating a large number of parameters, and one might assume that this would reduce its accuracy. However, it benefits from large samples of genomes. Large samples increase the accuracy of internal allele frequency estimates, and this improves the accuracy of genotype and ploidy estimates. In large samples of low-coverage genomes, HMMploidy outperforms all other estimators. It does not require a reference genome of known ploidy. The power of the method increases with coverage and sample size but decreases with ploidy. Consequently, high coverage or large samples may be needed if ploidy is high. The method is slower than some alternative methods, but run time is not excessive. Run time increases with number of windows but isn't otherwise affected by genome size. It should be feasible even with large genomes, provided that the number of windows is not too large. The authors apply their method and several alternatives to isolates of a pathogenic yeast, Cryptococcus neoformans, obtained from HIV-infected patients. With these data, HMMploidy replicated previous findings of polyploidy and aneuploidy. There were several surprises. For example, HMMploidy estimates the same ploidy in two isolates taken on different days from a single patient, even though sequencing coverage was three times as high on the later day as on the earlier one. These findings were replicated in data that were down-sampled to mimic low coverage. Three alternative methods (ploidyNGS [1], nQuire, and nQuire.Den [3]) estimated the highest ploidy considered in all samples from each patient. The present authors suggest that these results are artifactual and reflect the wide variation in allele frequencies. Because of this variation, these methods seem to have preferred the model with the largest number of parameters. HMMploidy represents a new and potentially useful tool for studying variation in ploidy. It will be of most use in studying the genetics of asexual organisms and cancers, where aneuploidy imposes little or no penalty on reproduction. It should also be useful for detecting assembly errors in de novo genome sequences from non-model organisms. References [1] Augusto Corrêa dos Santos R, Goldman GH, Riaño-Pachón DM (2017) ploidyNGS: visually exploring ploidy with Next Generation Sequencing data. Bioinformatics, 33, 2575–2576. https://doi.org/10.1093/bioinformatics/btx204 [2] Soraggi S, Rhodes J, Altinkaya I, Tarrant O, Balloux F, Fisher MC, Fumagalli M (2022) HMMploidy: inference of ploidy levels from short-read sequencing data. bioRxiv, 2021.06.29.450340, ver. 6 peer-reviewed and recommended by Peer Community in Mathematical and Computational Biology. https://doi.org/10.1101/2021.06.29.450340 [3] Weiß CL, Pais M, Cano LM, Kamoun S, Burbano HA (2018) nQuire: a statistical framework for ploidy estimation using next generation sequencing. BMC Bioinformatics, 19, 122. https://doi.org/10.1186/s12859-018-2128-z | HMMploidy: inference of ploidy levels from short-read sequencing data | Samuele Soraggi, Johanna Rhodes, Isin Altinkaya, Oliver Tarrant, Francois Balloux, Matthew C Fisher, Matteo Fumagalli | <p>The inference of ploidy levels from genomic data is important to understand molecular mechanisms underpinning genome evolution. However, current methods based on allele frequency and sequencing depth variation do not have power to infer ploidy ... | | Design and analysis of algorithms, Evolutionary Biology, Genetics and population Genetics, Probability and statistics | Alan Rogers | 2021-07-01 05:26:31 | ||
02 May 2023
Population genetics: coalescence rate and demographic parameters inferenceEstimates of Effective Population Size in Subdivided PopulationsRecommended by Alan Rogers based on reviews by 2 anonymous reviewers
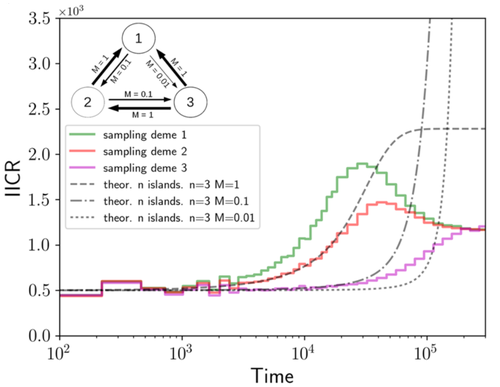
We often use genetic data from a single site, or even a single individual, to estimate the history of effective population size, Ne, over time scales in excess of a million years. Mazet and Noûs [2] emphasize that such estimates may not mean what they seem to mean. The ups and downs of Ne may reflect changes in gene flow or selection, rather than changes in census population size. In fact, gene flow may cause Ne to decline even if the rate of gene flow has remained constant. Consider for example the estimates of archaic population size in Fig. 1, which show an apparent decline in population size between roughly 700 kya and 300 kya. It is tempting to interpret this as evidence of a declining number of individuals, but that is not the only plausible interpretation. Each of these estimates is based on the genome of a single diploid individual. As we trace the ancestry of that individual backwards into the past, the ancestors are likely to remain in the same locale for at least a generation or two. Being neighbors, there’s a chance they will mate. This implies that in the recent past, the ancestors of a sampled individual lived in a population of small effective size. As we continue backwards into the past, there is more and more time for the ancestors to move around on the landscape. The farther back we go, the less likely they are to be neighbors, and the less likely they are to mate. In this more remote past, the ancestors of our sample lived in a population of larger effective size, even if neither the number of individuals nor the rate of gene flow has changed. For awhile then, Ne should increase as we move backwards into the past. This process does not continue forever, because eventually the ancestors will be randomly distributed across the population as a whole. We therefore expect Ne to increase towards an asymptote, which represents the effective size of the entire population. This simple story gets more complex if there is change in either the census size or the rate of gene flow. Mazet and Noûs [2] have shown that one can mimic real estimates of population history using models in which the rate of gene flow varies, but census size does not. This implies that the curves in Fig. 1 are ambiguous. The observed changes in Ne could reflect changes in census size, gene flow, or both. For this reason, Mazet and Noûs [2] would like to replace the term “effective population size” with an alternative, the “inverse instantaneous coalescent rate,” or IIRC. I don’t share this preference, because the same critique could be made of all definitions of Ne. For example, Wright [3, p. 108] showed in 1931 that Ne varies in response to the sex ratio, and this implies that changes in Ne need not involve any change in census size. This is also true when populations are geographically structured, as Mazet and Noûs [2] have emphasized, but this does not seem to require a new vocabulary.
Figure 1: PSMC estimates of the history of population size based on three archaic genomes: two Neanderthals and a Denisovan [1]. Mazet and Noûs [2] also show that estimates of Ne can vary in response to selection. It is not hard to see why such an effect might exist. In genomic regions affected by directional or purifying selection, heterozygosity is low, and common ancestors tend to be recent. Such regions may contribute to small estimates of recent Ne. In regions under balancing selection, heterozygosity is high, and common ancestors tend to be ancient. Such regions may contribute to large estimates of ancient Ne. The magnitude of this effect presumably depends on the fraction of the genome under selection and the rate of recombination. In summary, this article describes several processes that can affect estimates of the history of effective population size. This makes existing estimates ambiguous. For example, should we interpret Fig. 1 as evidence of a declining number of archaic individuals, or in terms of gene flow among archaic subpopulations? But these questions also present research opportunities. If the observed decline reflects gene flow, what does this imply about the geographic structure of archaic populations? Can we resolve the ambiguity by integrating samples from different locales, or using archaeological estimates of population density or interregional trade? REFERENCES [1] Fabrizio Mafessoni et al. “A high-coverage Neandertal genome from Chagyrskaya Cave”. Proceedings of the National Academy of Sciences, USA 117.26 (2020), pp. 15132–15136. https://doi.org/10.1073/pnas.2004944117. [2] Olivier Mazet and Camille Noûs. “Population genetics: coalescence rate and demographic parameters inference”. arXiv, ver. 2 peer-reviewed and recommended by Peer Community In Mathematical and Computational Biology (2023). https://doi.org/10.48550/ARXIV.2207.02111. [3] Sewall Wright. “Evolution in mendelian populations”. Genetics 16 (1931), pp. 97–159. https://doi.org/10.48550/ARXIV.2207.0211110.1093/genetics/16.2.97. | Population genetics: coalescence rate and demographic parameters inference | Olivier Mazet, Camille Noûs | <p style="text-align: justify;">We propose in this article a brief description of the work, over almost a decade, resulting from a collaboration between mathematicians and biologists from four different research laboratories, identifiable as the c... | | Genetics and population Genetics, Probability and statistics | Alan Rogers | Joseph Lachance, Anonymous | 2022-07-11 14:03:04 | |
18 Sep 2023
General encoding of canonical k-mersMinimal encodings of canonical k-mers for general alphabets and even k-mer sizesRecommended by Paul Medvedev based on reviews by 2 anonymous reviewersAs part of many bioinformatics tools, one encodes a k-mer, which is a string, into an integer. The natural encoding uses a bijective function to map the k-mers onto the interval [0, s^k - ], where s is the alphabet size. This encoding is minimal, in the sense that the encoded integer ranges from 0 to the number of represented k-mers minus 1. However, often one is only interested in encoding canonical k-mers. One common definition is that a k-mer is canonical if it is lexicographically not larger than its reverse complement. In this case, only about half the k-mers from the universe of k-mers are canonical, and the natural encoding is no longer minimal. For the special case of a DNA alphabet and odd k, there exists a "parity-based" encoding for canonical k-mers which is minimal. In [1], the author presents a minimal encoding for canonical k-mers that works for general alphabets and both odd and even k. They also give an efficient bit-based representation for the DNA alphabet. This paper fills a theoretically interesting and often overlooked gap in how to encode k-mers as integers. It is not yet clear what practical applications this encoding will have, as the author readily acknowledges in the manuscript. Neither the author nor the reviewers are aware of any practical situations where the lack of a minimal encoding "leads to serious limitations." However, even in an applied field like bioinformatics, it would be short-sighted to only value theoretical work that has an immediate application; often, the application is several hops away and not apparent at the time of the original work. In fact, I would speculate that there may be significant benefits reaped if there was more theoretical attention paid to the fact that k-mers are often restricted to be canonical. Many papers in the field sweep under the rug the fact that k-mers are made canonical, leaving it as an implementation detail. This may indicate that the theory to describe and analyze this situation is underdeveloped. This paper makes a step forward to develop this theory, and I am hopeful that it may lead to substantial practical impact in the future. References [1] Roland Wittler (2023) "General encoding of canonical k-mers. bioRxiv, ver.2, peer-reviewed and recommended by Peer Community in Mathematical and Computational Biology https://doi.org/10.1101/2023.03.09.531845 | General encoding of canonical *k*-mers | Roland Wittler | <p style="text-align: justify;">To index or compare sequences efficiently, often <em>k</em>-mers, i.e., substrings of fixed length <em>k</em>, are used. For efficient indexing or storage, <em>k</em>-mers are encoded as integers, e.g., applying som... | | Combinatorics, Computational complexity, Genomics and Transcriptomics | Paul Medvedev | Anonymous | 2023-03-13 17:01:37 | |
26 May 2021
An efficient algorithm for estimating population history from genetic dataAn efficient implementation of legofit software to infer demographic histories from population genetic dataRecommended by Matteo Fumagalli based on reviews by Fernando Racimo and 1 anonymous reviewer
The estimation of demographic parameters from population genetic data has been the subject of many scientific studies [1]. Among these efforts, legofit was firstly proposed in 2019 as a tool to infer size changes, subdivision and gene flow events from patterns of nucleotidic variation [2]. The first release of legofit used a stochastic algorithm to fit population parameters to the observed data. As it requires simulations to evaluate the fitting of each model, it is computationally intensive and can only be deployed on high-performance computing clusters. To overcome this issue, Rogers proposes a new implementation of legofit based on a deterministic algorithm that allows the estimation of demographic histories to be computationally faster and more accurate [3]. The new algorithm employs a continuous-time Markov chain that traces the ancestry of each sample into the past. The calculations are now divided into two steps, the first one being solved numerically. To test the hypothesis that the new implementation of legofit produces a more desirable performance, Rogers generated extensive simulations of genomes from African, European, Neanderthal and Denisovan populations with msprime [4]. Additionally, legofit was tested on real genetic data from samples of said populations, following a previously published study [5]. Based on simulations, the new deterministic algorithm is more than 1600 times faster than the previous stochastic model. Notably, the new version of legofit produces smaller residual errors, although the overall accuracy to estimate population parameters is comparable to the one obtained using the stochastic algorithm. When applied to real data, the new implementation of legofit was able to recapitulate previous findings of a complex demographic model with early gene flow from humans to Neanderthal [5]. Notably, the new implementation generates better discrimination between models, therefore leading to a better precision at predicting the population history. Some parameters estimated from real data point towards unrealistic scenarios, suggesting that the initial model could be misspecified. Further research is needed to fully explore the parameter range that can be evaluated by legofit, and to clarify the source of any associated bias. Additionally, the inclusion of data uncertainty in parameter estimation and model selection may be required to apply legofit to low-coverage high-throughput sequencing data [6]. Nevertheless, legofit is an efficient, accessible and user-friendly software to infer demographic parameters from genetic data and can be widely applied to test hypotheses in evolutionary biology. The new implementation of legofit software is freely available at https://github.com/alanrogers/legofit. References [1] Spence JP, Steinrücken M, Terhorst J, Song YS (2018) Inference of population history using coalescent HMMs: review and outlook. Current Opinion in Genetics & Development, 53, 70–76. https://doi.org/10.1016/j.gde.2018.07.002 [2] Rogers AR (2019) Legofit: estimating population history from genetic data. BMC Bioinformatics, 20, 526. https://doi.org/10.1186/s12859-019-3154-1 [3] Rogers AR (2021) An Efficient Algorithm for Estimating Population History from Genetic Data. bioRxiv, 2021.01.23.427922, ver. 5 peer-reviewed and recommended by Peer community in Mathematical and Computational Biology. https://doi.org/10.1101/2021.01.23.427922 [4] Kelleher J, Etheridge AM, McVean G (2016) Efficient Coalescent Simulation and Genealogical Analysis for Large Sample Sizes. PLOS Computational Biology, 12, e1004842. https://doi.org/10.1371/journal.pcbi.1004842 [5] Rogers AR, Harris NS, Achenbach AA (2020) Neanderthal-Denisovan ancestors interbred with a distantly related hominin. Science Advances, 6, eaay5483. https://doi.org/10.1126/sciadv.aay5483 [6] Soraggi S, Wiuf C, Albrechtsen A (2018) Powerful Inference with the D-Statistic on Low-Coverage Whole-Genome Data. G3 Genes|Genomes|Genetics, 8, 551–566. https://doi.org/10.1534/g3.117.300192 | An efficient algorithm for estimating population history from genetic data | Alan R. Rogers | <p style="text-align: justify;">The Legofit statistical package uses genetic data to estimate parameters describing population history. Previous versions used computer simulations to estimate probabilities, an approach that limited both speed and ... | | Combinatorics, Genetics and population Genetics | Matteo Fumagalli | 2021-01-26 20:04:35 | ||
04 Feb 2022
Non-Markovian modelling highlights the importance of age structure on Covid-19 epidemiological dynamicsImportance of age structure on modeling COVID-19 epidemiological dynamicsRecommended by Chen Liao based on reviews by Facundo Muñoz, Kevin Bonham and 1 anonymous reviewerCOVID-19 spread around the globe in early 2020 and has deeply changed our everyday life [1]. Mathematical models allow us to estimate R0 (basic reproduction number), understand the progression of viral infection, explore the impacts of quarantine on the epidemic, and most importantly, predict the future outbreak [2]. The most classical model is SIR, which describes time evolution of three variables, i.e., number of susceptible people (S), number of people infected (I), and number of people who have recovered (R), based on their transition rates [3]. Despite the simplicity, SIR model produces several general predictions that have important implications for public health [3]. SIR model includes three populations with distinct labels and is thus compartmentalized. Extra compartments can be added to describe additional states of populations, for example, people exposed to the virus but not yet infectious. However, a model with more compartments, though more realistic, is also more difficult to parameterize and analyze. The study by Reyné et al. [4] proposed an alternative formalism based on PDE (partial differential equation), which allows modeling different biological scenarios without the need of adding additional compartments. As illustrated, the authors modeled hospital admission dynamics in a vaccinated population only with 8 general compartments. The main conclusion of this study is that the vaccination level till 2021 summer was insufficient to prevent a new epidemic in France. Additionally, the authors used alternative data sources to estimate the age-structured contact patterns. By sensitivity analysis on a daily basis, they found that the 9 parameters in the age-structured contact matrix are most variable and thus shape Covid19 pandemic dynamics. This result highlights the importance of incorporating age structure of the host population in modeling infectious diseases. However, a relevant potential limitation is that the contact matrix was assumed to be constant throughout the simulations. To account for time dependence of the contact matrix, social and behavioral factors need to be integrated [5]. References [1] Hu B, Guo H, Zhou P, Shi Z-L (2021) Characteristics of SARS-CoV-2 and COVID-19. Nature Reviews Microbiology, 19, 141–154. https://doi.org/10.1038/s41579-020-00459-7 [2] Jinxing G, Yongyue W, Yang Z, Feng C (2020) Modeling the transmission dynamics of COVID-19 epidemic: a systematic review. The Journal of Biomedical Research, 34, 422–430. https://doi.org/10.7555/JBR.34.20200119 [3] Tolles J, Luong T (2020) Modeling Epidemics With Compartmental Models. JAMA, 323, 2515–2516. https://doi.org/10.1001/jama.2020.8420 [4] Reyné B, Richard Q, Noûs C, Selinger C, Sofonea MT, Djidjou-Demasse R, Alizon S (2022) Non-Markovian modelling highlights the importance of age structure on Covid-19 epidemiological dynamics. medRxiv, 2021.09.30.21264339, ver. 3 peer-reviewed and recommended by Peer Community in Mathematical and Computational Biology. https://doi.org/10.1101/2021.09.30.21264339 [5] Bedson J, Skrip LA, Pedi D, Abramowitz S, Carter S, Jalloh MF, Funk S, Gobat N, Giles-Vernick T, Chowell G, de Almeida JR, Elessawi R, Scarpino SV, Hammond RA, Briand S, Epstein JM, Hébert-Dufresne L, Althouse BM (2021) A review and agenda for integrated disease models including social and behavioural factors. Nature Human Behaviour, 5, 834–846 https://doi.org/10.1038/s41562-021-01136-2 | Non-Markovian modelling highlights the importance of age structure on Covid-19 epidemiological dynamics | Bastien Reyné, Quentin Richard, Camille Noûs, Christian Selinger, Mircea T. Sofonea, Ramsès Djidjou-Demasse, Samuel Alizon | <p style="text-align: justify;">The Covid-19 pandemic outbreak was followed by a huge amount of modelling studies in order to rapidly gain insights to implement the best public health policies. Most of these compartmental models involved ordinary ... | | Dynamical systems, Epidemiology, Systems biology | Chen Liao | 2021-10-04 13:49:51 | ||
10 Apr 2024
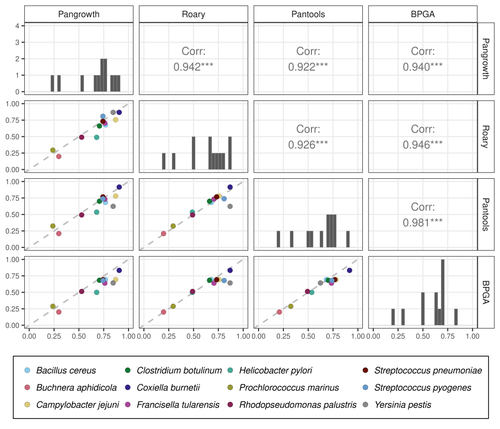
Revisiting pangenome openness with k-mersFaster method for estimating the openness of speciesRecommended by Leo van Iersel based on reviews by Guillaume Marçais, Abiola Akinnubi and 1 anonymous reviewerWhen sequencing more and more genomes of a species (or a group of closely related species), a natural question to ask is how quickly the total number of distinct sequences grows as a function of the total number of sequenced genomes. A similar question can be asked about the number of distinct genes or the number of distinct k-mers (length-k subsequences). References [1] Parmigiani L., Wittler, R. and Stoye, J. (2024) "Revisiting pangenome openness with k-mers". bioRxiv, ver. 4 peer-reviewed and recommended by Peer Community In Mathematical and Computational Biology. https://doi.org/10.1101/2022.11.15.516472 | Revisiting pangenome openness with k-mers | Luca Parmigiani, Roland Wittler, Jens Stoye | <p style="text-align: justify;">Pangenomics is the study of related genomes collectively, usually from the same species or closely related taxa. Originally, pangenomes were defined for bacterial species. After the concept was extended to eukaryoti... | | Combinatorics, Genomics and Transcriptomics | Leo van Iersel | Guillaume Marçais, Yadong Zhang | 2022-11-22 14:48:18 | |
21 Feb 2022
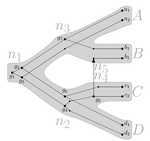
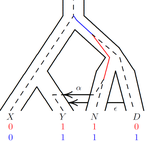
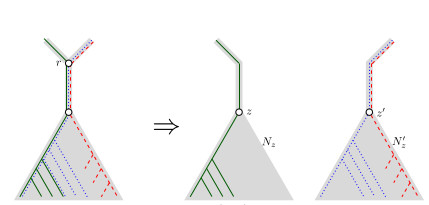
Consistency of orthology and paralogy constraints in the presence of gene transfersAllowing gene transfers doesn't make life easier for inferring orthology and paralogyRecommended by Barbara Holland based on reviews by 2 anonymous reviewersDetermining if genes are orthologous (i.e. homologous genes whose most common ancestor represents a speciation) or paralogous (homologous genes whose most common ancestor represents a duplication) is a foundational problem in bioinformatics. For instance, the input to almost all phylogenetic methods is a sequence alignment of genes assumed to be orthologous. Understanding if genes are paralogs or orthologs can also be important for assigning function, for example genes that have diverged following duplication may be more likely to have neofunctionalised or subfunctionalised compared to genes that have diverged following speciation, which may be more likely to have continued in a similar role. This paper by Jones et al (2022) contributes to a wide range of literature addressing the inference of orthology/paralogy relations but takes a different approach to explaining inconsistency between an assumed species phylogeny and a relation graph (a graph where nodes represent genes and edges represent that the two genes are orthologs). Rather than assuming that inconsistencies are the result of incorrect assessment of orthology (i.e. incorrect edges in the relation graph) they ask if the relation graph could be consistent with a species tree combined with some amount of lateral (horizontal) gene transfer. The two main questions addressed in this paper are (1) if a network N and a relation graph R are consistent, and (2) if – given a species tree S and a relation graph R – transfer arcs can be added to S in such a way that it becomes consistent with R? The first question hinges on the concept of a reconciliation between a gene tree and a network (section 2.1) and amounts to asking if a gene tree can be found that can both be reconciled with the network and consistent with the relation graph. The authors show that the problem is NP hard. Furthermore, the related problem of attempting to find a solution using k or fewer transfers is NP-hard, and also W[1] hard implying that it is in a class of problems for which fixed parameter tractable solutions have not been found. The proof of NP hardness is by reduction to the k-multi-coloured clique problem via an intermediate problem dubbed “antichain on trees” (Section 3). The “antichain on trees” construction may be of interest to others working on algorithmic complexity with phylogenetic networks. In the second question the possible locations of transfers are not specified (or to put it differently any time consistent transfer arc is considered possible) and it is shown that it generally will be possible to add transfer edges to S in such a way that it can be consistent with R. However, the natural extension to this question of asking if it can be done with k or fewer added arcs is also NP hard. Many of the proofs in the paper are quite technical, but the authors have relegated a lot of this detail to the appendix thus ensuring that the main ideas and results are clear to follow in the main text. I am grateful to both reviewers for their detailed reviews and through checking of the proofs. References Jones M, Lafond M, Scornavacca C (2022) Consistency of orthology and paralogy constraints in the presence of gene transfers. arXiv:1705.01240 [cs], ver. 6 peer-reviewed and recommended by Peer Community in Mathematical and Computational Biology. https://arxiv.org/abs/1705.01240 | Consistency of orthology and paralogy constraints in the presence of gene transfers | Mark Jones, Manuel Lafond, Celine Scornavacca | <p style="text-align: justify;">Orthology and paralogy relations are often inferred by methods based on gene sequence similarity that yield a graph depicting the relationships between gene pairs. Such relation graphs frequently contain errors, as ... | | Computational complexity, Design and analysis of algorithms, Evolutionary Biology, Graph theory | Barbara Holland | 2021-06-30 15:01:44 | ||
07 Dec 2021
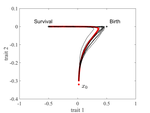
The emergence of a birth-dependent mutation rate in asexuals: causes and consequencesA new perspective in modeling mutation rate for phenotypically structured populationsRecommended by Yuan Lou based on reviews by Hirohisa Kishino and 1 anonymous reviewerIn standard mutation-selection models for describing the dynamics of phenotypically structured populations, it is often assumed that the mutation rate is constant across the phenotypes. In particular, this assumption leads to a constant diffusion coefficient for diffusion approximation models (Perthame, 2007 and references therein). Patout et al (2021) study the dependence of the mutation rate on the birth rate, by introducing some diffusion approximations at the population level, derived from the large population limit of a stochastic, individual-based model. The reaction-diffusion model in this article is of the “cross-diffusion” type: The form of “cross-diffusion” also appeared in ecological literature as a type of biased movement behaviors for organisms (Shigesada et al., 1979). The key underlying assumption for “cross-diffusion” is that the transition probability at the individual level depends solely upon the condition at the departure point. Patout et al (2021) envision that a higher birth rate yields more mutations per unit of time. One of their motivations is that during cancer development, the mutation rates of cancer cells at the population level could be correlated with reproduction success. The reaction-diffusion approximation model derived in this article illustrates several interesting phenomena: For the time evolution situation, their model predicts different solution trajectories under various assumptions on the fitness function, e.g. the trajectory could initially move towards the birth optimum but eventually end up at the survival optimum. Their model also predicts that the mean fitness could be flat for some period of time, which might provide another alternative to explain observed data. At the steady-state level, their model suggests that the populations are more concentrated around the survival optimum, which agrees with the evolution of the time-dependent solution trajectories. Perhaps one of the most interesting contributions of the study of Patout et al (2021) is to give us a new perspective to model the mutation rate in phenotypically structured populations and subsequently, and to help us better understand the connection between mutation and selection. More broadly, this article offers some new insights into the evolutionary dynamics of phenotypically structured populations, along with potential implications in empirical studies. References Perthame B (2007) Transport Equations in Biology Frontiers in Mathematics. Birkhäuser, Basel. https://doi.org/10.1007/978-3-7643-7842-4_2 Patout F, Forien R, Alfaro M, Papaïx J, Roques L (2021) The emergence of a birth-dependent mutation rate in asexuals: causes and consequences. bioRxiv, 2021.06.11.448026, ver. 3 peer-reviewed and recommended by Peer Community in Mathematical and Computational Biology. https://doi.org/10.1101/2021.06.11.448026 Shigesada N, Kawasaki K, Teramoto E (1979) Spatial segregation of interacting species. Journal of Theoretical Biology, 79, 83–99. https://doi.org/10.1016/0022-5193(79)90258-3 | The emergence of a birth-dependent mutation rate in asexuals: causes and consequences | Florian Patout, Raphaël Forien, Matthieu Alfaro, Julien Papaïx, Lionel Roques | <p style="text-align: justify;">In unicellular organisms such as bacteria and in most viruses, mutations mainly occur during reproduction. Thus, genotypes with a high birth rate should have a higher mutation rate. However, standard models of asexu... | | Dynamical systems, Evolutionary Biology, Probability and statistics, Stochastic dynamics | Yuan Lou | Anonymous, Hirohisa Kishino | 2021-06-12 13:59:45 | |
12 Oct 2023
When Three Trees Go to WarBounding the reticulation number for three phylogenetic treesRecommended by Simone Linz based on reviews by Guillaume Scholz and Stefan GrünewaldReconstructing a phylogenetic network for a set of conflicting phylogenetic trees on the same set of leaves remains an active strand of research in mathematical and computational phylogenetic since 2005, when Baroni et al. [1] showed that the minimum number of reticulations h(T,T') needed to simultaneously embed two rooted binary phylogenetic trees T and T' into a rooted binary phylogenetic network is one less than the size of a maximum acyclic agreement forest for T and T'. In the same paper, the authors showed that h(T,T') is bounded from above by n-2, where n is the number of leaves of T and T' and that this bound is sharp. That is, for a fixed n, there exist two rooted binary phylogenetic trees T and T' such that h(T,T')=n-2. Since 2005, many papers have been published that develop exact algorithms and heuristics to solve the above NP-hard minimisation problem in practice, which is often referred to as Minimum Hybridisation in the literature, and that further investigate the mathematical underpinnings of Minimum Hybridisation and related problems. However, many such studies are restricted to two trees and much less is known about Minimum Hybridisation for when the input consists of more than two phylogenetic trees, which is the more relevant cases from a biological point of view. In [2], van Iersel, Jones, and Weller establish the first lower bound for the minimum reticulation number for more than two rooted binary phylogenetic trees, with a focus on exactly three trees. The above-mentioned connection between the minimum number of reticulations and maximum acyclic agreement forests does not extend to three (or more) trees. Instead, to establish their result, the authors use multi-labelled trees as an intermediate structure between phylogenetic trees and phylogenetic networks to show that, for each ε>0, there exist three caterpillar trees on n leaves such that any phylogenetic network that simultaneously embeds these three trees has at least (3/2 - ε)n reticulations. Perhaps unsurprising, caterpillar trees were also used by Baroni et al. [1] to establish that their upper bound on h(T,T') is sharp. Structurally, these trees have the property that each internal vertex is adjacent to a leaf. Each caterpillar tree can therefore be viewed as a sequence of characters, and it is exactly this viewpoint that is heavily used in [2]. More specifically, sequences with short common subsequences correspond to caterpillar trees that need many reticulations when embedded in a phylogenetic network. It would consequently be interesting to further investigate connections between caterpillar trees and certain types of sequences. Can they be used to shed more light on bounds for the minimum reticulation number? References [1] Baroni, M., Grünewald, S., Moulton, V., and Semple, C. (2005) "Bounding the number of hybridisation events for a consistent evolutionary history". J. Math. Biol. 51, 171–182. https://doi.org/10.1007/s00285-005-0315-9 | When Three Trees Go to War | Leo van Iersel and Mark Jones and Mathias Weller | <p style="text-align: justify;">How many reticulations are needed for a phylogenetic network to display a given set of k phylogenetic trees on n leaves? For k = 2, Baroni, Semple, and Steel [Ann. Comb. 8, 391-408 (2005)] showed that the answer is ... | | Combinatorics, Evolutionary Biology, Graph theory | Simone Linz | 2023-03-07 18:49:21 |


