
Latest recommendations

| Id | Title | Authors | Abstract | Picture | Thematic fields | Recommender | Reviewers▼ | Submission date | |
|---|---|---|---|---|---|---|---|---|---|
02 May 2023
Population genetics: coalescence rate and demographic parameters inferenceEstimates of Effective Population Size in Subdivided PopulationsRecommended by Alan Rogers based on reviews by 2 anonymous reviewers based on reviews by 2 anonymous reviewers
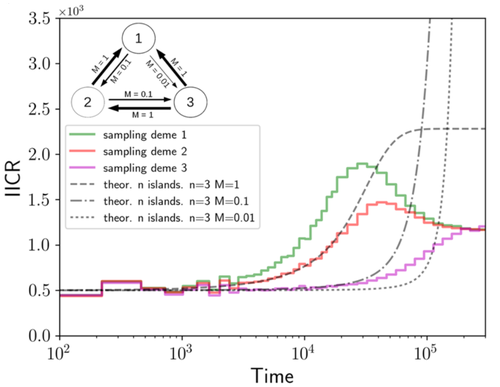
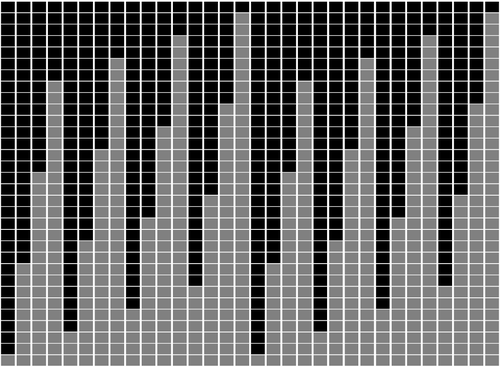
We often use genetic data from a single site, or even a single individual, to estimate the history of effective population size, Ne, over time scales in excess of a million years. Mazet and Noûs [2] emphasize that such estimates may not mean what they seem to mean. The ups and downs of Ne may reflect changes in gene flow or selection, rather than changes in census population size. In fact, gene flow may cause Ne to decline even if the rate of gene flow has remained constant. Consider for example the estimates of archaic population size in Fig. 1, which show an apparent decline in population size between roughly 700 kya and 300 kya. It is tempting to interpret this as evidence of a declining number of individuals, but that is not the only plausible interpretation. Each of these estimates is based on the genome of a single diploid individual. As we trace the ancestry of that individual backwards into the past, the ancestors are likely to remain in the same locale for at least a generation or two. Being neighbors, there’s a chance they will mate. This implies that in the recent past, the ancestors of a sampled individual lived in a population of small effective size. As we continue backwards into the past, there is more and more time for the ancestors to move around on the landscape. The farther back we go, the less likely they are to be neighbors, and the less likely they are to mate. In this more remote past, the ancestors of our sample lived in a population of larger effective size, even if neither the number of individuals nor the rate of gene flow has changed. For awhile then, Ne should increase as we move backwards into the past. This process does not continue forever, because eventually the ancestors will be randomly distributed across the population as a whole. We therefore expect Ne to increase towards an asymptote, which represents the effective size of the entire population. This simple story gets more complex if there is change in either the census size or the rate of gene flow. Mazet and Noûs [2] have shown that one can mimic real estimates of population history using models in which the rate of gene flow varies, but census size does not. This implies that the curves in Fig. 1 are ambiguous. The observed changes in Ne could reflect changes in census size, gene flow, or both. For this reason, Mazet and Noûs [2] would like to replace the term “effective population size” with an alternative, the “inverse instantaneous coalescent rate,” or IIRC. I don’t share this preference, because the same critique could be made of all definitions of Ne. For example, Wright [3, p. 108] showed in 1931 that Ne varies in response to the sex ratio, and this implies that changes in Ne need not involve any change in census size. This is also true when populations are geographically structured, as Mazet and Noûs [2] have emphasized, but this does not seem to require a new vocabulary.
Figure 1: PSMC estimates of the history of population size based on three archaic genomes: two Neanderthals and a Denisovan [1]. Mazet and Noûs [2] also show that estimates of Ne can vary in response to selection. It is not hard to see why such an effect might exist. In genomic regions affected by directional or purifying selection, heterozygosity is low, and common ancestors tend to be recent. Such regions may contribute to small estimates of recent Ne. In regions under balancing selection, heterozygosity is high, and common ancestors tend to be ancient. Such regions may contribute to large estimates of ancient Ne. The magnitude of this effect presumably depends on the fraction of the genome under selection and the rate of recombination. In summary, this article describes several processes that can affect estimates of the history of effective population size. This makes existing estimates ambiguous. For example, should we interpret Fig. 1 as evidence of a declining number of archaic individuals, or in terms of gene flow among archaic subpopulations? But these questions also present research opportunities. If the observed decline reflects gene flow, what does this imply about the geographic structure of archaic populations? Can we resolve the ambiguity by integrating samples from different locales, or using archaeological estimates of population density or interregional trade? REFERENCES [1] Fabrizio Mafessoni et al. “A high-coverage Neandertal genome from Chagyrskaya Cave”. Proceedings of the National Academy of Sciences, USA 117.26 (2020), pp. 15132–15136. https://doi.org/10.1073/pnas.2004944117. [2] Olivier Mazet and Camille Noûs. “Population genetics: coalescence rate and demographic parameters inference”. arXiv, ver. 2 peer-reviewed and recommended by Peer Community In Mathematical and Computational Biology (2023). https://doi.org/10.48550/ARXIV.2207.02111. [3] Sewall Wright. “Evolution in mendelian populations”. Genetics 16 (1931), pp. 97–159. https://doi.org/10.48550/ARXIV.2207.0211110.1093/genetics/16.2.97. | Population genetics: coalescence rate and demographic parameters inference | Olivier Mazet, Camille Noûs | <p style="text-align: justify;">We propose in this article a brief description of the work, over almost a decade, resulting from a collaboration between mathematicians and biologists from four different research laboratories, identifiable as the c... | | Genetics and population Genetics, Probability and statistics | Alan Rogers | Joseph Lachance, Anonymous | 2022-07-11 14:03:04 | |
14 Mar 2023
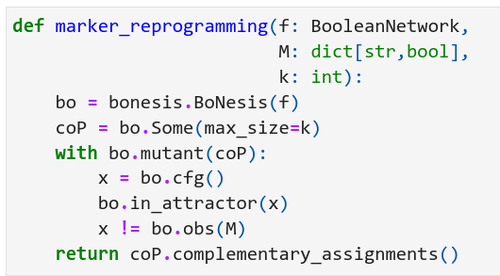
Marker and source-marker reprogramming of Most Permissive Boolean networks and ensembles with BoNesisReprogramming of locally-monotone Boolean networks with BoNesisRecommended by Sergiu Ivanov based on reviews by Ismail Belgacem and 1 anonymous reviewerReprogramming of cellular networks is a well known challenge in computational biology consisting first of all in properly representing an ensemble of networks having a role in a phenomenon of interest, and secondly in designing strategies to alter the functioning of this ensemble in the desired direction. Important applications involve disease study: a therapy can be seen as a reprogramming strategy, and the disease itself can be considered a result of a series of adversarial reprogramming actions. The origins of this domain go back to the seminal paper by Barabási et al. [1] which formalized the concept of network medicine. An abstract tool which has gathered considerable success in network medicine and network biology are Boolean networks: sets of Boolean variables, each equipped with a Boolean update function describing how to compute the next value of the variable from the values of the other variables. Despite apparent dissimilarity with the biological systems which involve varying quantities and continuous processes, Boolean networks have been very effective in representing biological networks whose entities are typically seen as being on or off. Particular examples are protein signalling networks as well as gene regulatory networks. The paper [2] by Loïc Paulevé presents a versatile tool for tackling reprogramming of Boolean networks seen as models of biological networks. The problem of reprogramming is often formulated as the problem of finding a set of perturbations which guarantee some properties on the attractors. The work [2] relies on the most permissive semantics [3], which together with the modelling assumption allows for considerable speed-up in the practically relevant subclass of locally-monotone Boolean networks. The paper is structured as a tutorial. It starts by introducing the formalism, defining 4 different general variants of reprogramming under the most permissive semantics, and presenting evaluations of their complexity in terms of the polynomial hierarchy. The author then describes the software tool BoNesis which can handle different problems related to Boolean networks, and in particular the 4 reprogramming variants. The presentation includes concrete code examples with their output, which should be very helpful for future users. The paper [2] introduces a novel scenario: reprogramming of ensembles of Boolean networks delineated by some properties, including for example the property of having a given interaction graph. Ensemble reprogramming looks particularly promising in situations in which the biological knowledge is insufficient to fully determine all the update functions, i.e. in the majority of modelling situations. Finally, the author also shows how BoNesis can be used to deal with sequential reprogramming, which is another promising direction in computational controllability, potentially enabling more efficient therapies [4,5]. REFERENCES
| Marker and source-marker reprogramming of Most Permissive Boolean networks and ensembles with BoNesis | Loïc Paulevé | <p style="text-align: justify;">Boolean networks (BNs) are discrete dynamical systems with applications to the modeling of cellular behaviors. In this paper, we demonstrate how the software BoNesis can be employed to exhaustively identify combinat... | | Combinatorics, Computational complexity, Dynamical systems, Molecular Biology, Systems biology | Sergiu Ivanov | Ismail Belgacem, Anonymous | 2022-08-31 15:00:21 | |
10 Apr 2024
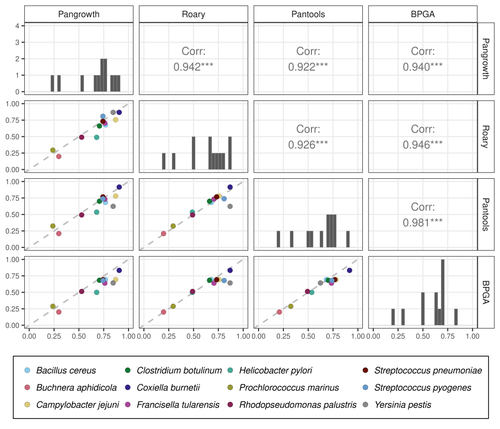
Revisiting pangenome openness with k-mersFaster method for estimating the openness of speciesRecommended by Leo van Iersel based on reviews by Guillaume Marçais, Abiola Akinnubi and 1 anonymous reviewerWhen sequencing more and more genomes of a species (or a group of closely related species), a natural question to ask is how quickly the total number of distinct sequences grows as a function of the total number of sequenced genomes. A similar question can be asked about the number of distinct genes or the number of distinct k-mers (length-k subsequences). References [1] Parmigiani L., Wittler, R. and Stoye, J. (2024) "Revisiting pangenome openness with k-mers". bioRxiv, ver. 4 peer-reviewed and recommended by Peer Community In Mathematical and Computational Biology. https://doi.org/10.1101/2022.11.15.516472 | Revisiting pangenome openness with k-mers | Luca Parmigiani, Roland Wittler, Jens Stoye | <p style="text-align: justify;">Pangenomics is the study of related genomes collectively, usually from the same species or closely related taxa. Originally, pangenomes were defined for bacterial species. After the concept was extended to eukaryoti... | | Combinatorics, Genomics and Transcriptomics | Leo van Iersel | Guillaume Marçais, Yadong Zhang | 2022-11-22 14:48:18 | |
07 Dec 2021
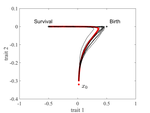
The emergence of a birth-dependent mutation rate in asexuals: causes and consequencesA new perspective in modeling mutation rate for phenotypically structured populationsRecommended by Yuan Lou based on reviews by Hirohisa Kishino and 1 anonymous reviewerIn standard mutation-selection models for describing the dynamics of phenotypically structured populations, it is often assumed that the mutation rate is constant across the phenotypes. In particular, this assumption leads to a constant diffusion coefficient for diffusion approximation models (Perthame, 2007 and references therein). Patout et al (2021) study the dependence of the mutation rate on the birth rate, by introducing some diffusion approximations at the population level, derived from the large population limit of a stochastic, individual-based model. The reaction-diffusion model in this article is of the “cross-diffusion” type: The form of “cross-diffusion” also appeared in ecological literature as a type of biased movement behaviors for organisms (Shigesada et al., 1979). The key underlying assumption for “cross-diffusion” is that the transition probability at the individual level depends solely upon the condition at the departure point. Patout et al (2021) envision that a higher birth rate yields more mutations per unit of time. One of their motivations is that during cancer development, the mutation rates of cancer cells at the population level could be correlated with reproduction success. The reaction-diffusion approximation model derived in this article illustrates several interesting phenomena: For the time evolution situation, their model predicts different solution trajectories under various assumptions on the fitness function, e.g. the trajectory could initially move towards the birth optimum but eventually end up at the survival optimum. Their model also predicts that the mean fitness could be flat for some period of time, which might provide another alternative to explain observed data. At the steady-state level, their model suggests that the populations are more concentrated around the survival optimum, which agrees with the evolution of the time-dependent solution trajectories. Perhaps one of the most interesting contributions of the study of Patout et al (2021) is to give us a new perspective to model the mutation rate in phenotypically structured populations and subsequently, and to help us better understand the connection between mutation and selection. More broadly, this article offers some new insights into the evolutionary dynamics of phenotypically structured populations, along with potential implications in empirical studies. References Perthame B (2007) Transport Equations in Biology Frontiers in Mathematics. Birkhäuser, Basel. https://doi.org/10.1007/978-3-7643-7842-4_2 Patout F, Forien R, Alfaro M, Papaïx J, Roques L (2021) The emergence of a birth-dependent mutation rate in asexuals: causes and consequences. bioRxiv, 2021.06.11.448026, ver. 3 peer-reviewed and recommended by Peer Community in Mathematical and Computational Biology. https://doi.org/10.1101/2021.06.11.448026 Shigesada N, Kawasaki K, Teramoto E (1979) Spatial segregation of interacting species. Journal of Theoretical Biology, 79, 83–99. https://doi.org/10.1016/0022-5193(79)90258-3 | The emergence of a birth-dependent mutation rate in asexuals: causes and consequences | Florian Patout, Raphaël Forien, Matthieu Alfaro, Julien Papaïx, Lionel Roques | <p style="text-align: justify;">In unicellular organisms such as bacteria and in most viruses, mutations mainly occur during reproduction. Thus, genotypes with a high birth rate should have a higher mutation rate. However, standard models of asexu... | | Dynamical systems, Evolutionary Biology, Probability and statistics, Stochastic dynamics | Yuan Lou | Anonymous, Hirohisa Kishino | 2021-06-12 13:59:45 | |
18 Sep 2023
General encoding of canonical k-mersMinimal encodings of canonical k-mers for general alphabets and even k-mer sizesRecommended by Paul Medvedev based on reviews by 2 anonymous reviewersAs part of many bioinformatics tools, one encodes a k-mer, which is a string, into an integer. The natural encoding uses a bijective function to map the k-mers onto the interval [0, s^k - ], where s is the alphabet size. This encoding is minimal, in the sense that the encoded integer ranges from 0 to the number of represented k-mers minus 1. However, often one is only interested in encoding canonical k-mers. One common definition is that a k-mer is canonical if it is lexicographically not larger than its reverse complement. In this case, only about half the k-mers from the universe of k-mers are canonical, and the natural encoding is no longer minimal. For the special case of a DNA alphabet and odd k, there exists a "parity-based" encoding for canonical k-mers which is minimal. In [1], the author presents a minimal encoding for canonical k-mers that works for general alphabets and both odd and even k. They also give an efficient bit-based representation for the DNA alphabet. This paper fills a theoretically interesting and often overlooked gap in how to encode k-mers as integers. It is not yet clear what practical applications this encoding will have, as the author readily acknowledges in the manuscript. Neither the author nor the reviewers are aware of any practical situations where the lack of a minimal encoding "leads to serious limitations." However, even in an applied field like bioinformatics, it would be short-sighted to only value theoretical work that has an immediate application; often, the application is several hops away and not apparent at the time of the original work. In fact, I would speculate that there may be significant benefits reaped if there was more theoretical attention paid to the fact that k-mers are often restricted to be canonical. Many papers in the field sweep under the rug the fact that k-mers are made canonical, leaving it as an implementation detail. This may indicate that the theory to describe and analyze this situation is underdeveloped. This paper makes a step forward to develop this theory, and I am hopeful that it may lead to substantial practical impact in the future. References [1] Roland Wittler (2023) "General encoding of canonical k-mers. bioRxiv, ver.2, peer-reviewed and recommended by Peer Community in Mathematical and Computational Biology https://doi.org/10.1101/2023.03.09.531845 | General encoding of canonical *k*-mers | Roland Wittler | <p style="text-align: justify;">To index or compare sequences efficiently, often <em>k</em>-mers, i.e., substrings of fixed length <em>k</em>, are used. For efficient indexing or storage, <em>k</em>-mers are encoded as integers, e.g., applying som... | | Combinatorics, Computational complexity, Genomics and Transcriptomics | Paul Medvedev | Anonymous | 2023-03-13 17:01:37 | |
09 Sep 2020
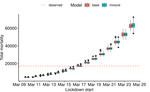
Bayesian investigation of SARS-CoV-2-related mortality in FranceModeling the effect of lockdown and other events on the dynamics of SARS-CoV-2 in FranceRecommended by Valery Forbes based on reviews by Wayne Landis and 1 anonymous reviewerThis study [1] used Bayesian models of the number of deaths through time across different regions of France to explore the effects of lockdown and other events (i.e., holding elections) on the dynamics of the SARS-CoV-2 epidemic. The models accurately predicted the number of deaths 2 to 3 weeks in advance, and results were similar to other recent models using different structure and input data. Viral reproduction numbers were not found to be different between weekends and week days, and there was no evidence that holding elections affected the number of deaths directly. However, exploring different scenarios of the timing of the lockdown showed that this had a substantial impact on the number of deaths. This is an interesting and important paper that can inform adaptive management strategies for controlling the spread of this virus, not just in France, but in other geographic areas. For example, the results found that there was a lag period between a change in management strategies (lockdown, social distancing, and the relaxing of controls) and the observed change in mortality. Also, there was a large variation in the impact of mitigation measures on the viral reproduction number depending on region, with lockdown being slightly more effective in denser regions. The authors provide an extensive amount of additional data and code as supplemental material, which increase the value of this contribution to the rapidly growing literature on SARS-CoV-2. References [1] Duchemin, L., Veber, P. and Boussau, B. (2020) Bayesian investigation of SARS-CoV-2-related mortality in France. medRxiv 2020.06.09.20126862, ver. 5 peer-reviewed and recommended by PCI Mathematical & Computational Biology. doi: 10.1101/2020.06.09.20126862 | Bayesian investigation of SARS-CoV-2-related mortality in France | Louis Duchemin, Philippe Veber, Bastien Boussau | <p>The SARS-CoV-2 epidemic in France has focused a lot of attention as it hashad one of the largest death tolls in Europe. It provides an opportunity to examine the effect of the lockdown and of other events on the dynamics of the epidemic. In par... | | Probability and statistics | Valery Forbes | 2020-07-08 17:29:46 | ||
24 Dec 2020
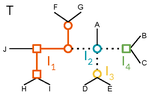
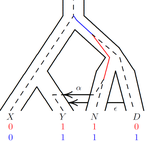
A linear time solution to the Labeled Robinson-Foulds Distance problemComparing reconciled gene trees in linear timeRecommended by Céline Scornavacca based on reviews by Barbara Holland, Gabriel Cardona, Jean-Baka Domelevo Entfellner and 1 anonymous reviewer
Unlike a species tree, a gene tree results not only from speciation events, but also from events acting at the gene level, such as duplications and losses of gene copies, and gene transfer events [1]. The reconciliation of phylogenetic trees consists in embedding a given gene tree into a known species tree and, doing so, determining the location of these gene-level events on the gene tree [2]. Reconciled gene trees can be seen as phylogenetic trees where internal node labels are used to discriminate between different gene-level events. Comparing them is of foremost importance in order to assess the performance of various reconciliation methods (e.g. [3]). References [1] Maddison, W. P. (1997). Gene trees in species trees. Systematic biology, 46(3), 523-536. doi: https://doi.org/10.1093/sysbio/46.3.523 | A linear time solution to the Labeled Robinson-Foulds Distance problem | Samuel Briand, Christophe Dessimoz, Nadia El-Mabrouk and Yannis Nevers | <p>Motivation Comparing trees is a basic task for many purposes, and especially in phylogeny where different tree reconstruction tools may lead to different trees, likely representing contradictory evolutionary information. While a large variety o... | | Combinatorics, Design and analysis of algorithms, Evolutionary Biology | Céline Scornavacca | 2020-08-20 21:06:23 | ||
07 Sep 2021
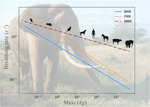
The origin of the allometric scaling of lung ventilation in mammalsHow mammals adapt their breath to body activity – and how this depends on body sizeRecommended by Wolfram Liebermeister based on reviews by Elad Noor, Oliver Ebenhöh, Stefan Schuster and Megumi InoueHow fast and how deep do animals breathe, and how does this depend on how active they are? To answer this question, one needs to dig deeply into how breathing works and what biophysical processes it involves. And one needs to think about body size. It is impressive how nature adapts the same body plan – e.g. the skeletal structure of mammals – to various shapes and sizes. From mice to whales, also the functioning of most organs remains the same; they are just differently scaled. Scaling does not just mean “making bigger or smaller”. As already noted by Galilei, body shapes change as they are adapted to body dimensions, and the same holds for physiological variables. Many such variables, for instance, heartbeat rates, follow scaling laws of the form y~x^a, where x denotes body mass and the exponent a is typically a multiple of ¼ [1]. These unusual exponents – instead of multiples of ⅓, which would be expected from simple geometrical scaling – are why these laws are called “allometric”. Kleiber’s law for metabolic rates, with a scaling exponent of ¾, is a classic example [2]. As shown by G. West, allometric laws can be explained through a few simple steps [1]. In his models, he focused on network-like organs such as the vascular system and assumed that these systems show a self-similar structure, with a fixed minimal unit (for instance, capillaries) but varying numbers of hierarchy levels depending on body size. To determine the flow through such networks, he employed biophysical models and optimality principles (for instance, assuming that oxygen must be transported at a minimal mechanical effort), and showed that the solutions – and the physiological variables – respect the known scaling relations. The paper “The origin of the allometric scaling of lung ventilation in mammals“ by Noël et al. [3], applies this thinking to the depth and rate of breathing in mammals. Scaling laws describing breathing in resting animals have been known since the 1950s [4], with exponents of 1 (for tidal volume) and -¼ (for breathing frequency). Equipped with a detailed biophysical model, Noël et al. revisit this question, extending these laws to other metabolic regimes. Their starting point is a model of the human lung, developed previously by two of the authors [5], which assumes that we meet our oxygen demand with minimal lung movements. To state this as an optimization problem, the model combines two submodels: a mechanical model describing the energetic effort of ventilation and a highly detailed model of convection and diffusion in self-similar lung geometries. Breathing depths and rates are computed by numerical optimization, and to obtain results for mammals of any size many of the model parameters are described by known scaling laws. As expected, the depth of breathing (measured by tidal volume) scales almost proportionally with body mass and increases with metabolic demand, while the breathing rate decreases with body mass, with an exponent of about -¼. However, the laws for the breathing rate hold only for basal activity; at higher metabolic rates, which are modeled here for the first time, the exponent deviates strongly from this value, in line with empirical data. Why is this paper important? The authors present a highly complex model of lung physiology that integrates a wide range of biophysical details and passes a difficult test: the successful prediction of unexplained scaling exponents. These scaling relations may help us transfer insights from animal models to humans and in reverse: data for breathing during exercise, which are easy to measure in humans, can be extrapolated to other species. Aside from the scaling laws, the model also reveals physiological mechanisms. In the larger lung branches, oxygen is transported mainly by air movement (convection), while in smaller branches air flow is slow and oxygen moves by diffusion. The transition between these regimes can occur at different depths in the lung: as the authors state, “the localization of this transition determines how ventilation should be controlled to minimize its energetic cost at any metabolic regime”. In the model, the optimal location for the transition depends on oxygen demand [5, 6]: the transition occurs deeper in the lung in exercise regimes than at rest, allowing for more oxygen to be taken up. However, the effects of this shift depend on body size: while small mammals generally use the entire exchange surface of their lungs, large mammals keep a reserve for higher activities, which becomes accessible as their transition zone moves at high metabolic rates. Hence, scaling can entail qualitative differences between species! Altogether, the paper shows how the dynamics of ventilation depend on lung morphology. But this may also play out in the other direction: if energy-efficient ventilation depends on body activity, and therefore on ecological niches, a niche may put evolutionary pressures on lung geometry. Hence, by understanding how deep and fast animals breathe, we may also learn about how behavior, physiology, and anatomy co-evolve. References [1] West GB, Brown JH, Enquist BJ (1997) A General Model for the Origin of Allometric Scaling Laws in Biology. Science 276 (5309), 122–126. https://doi.org/10.1126/science.276.5309.122 [2] Kleiber M (1947) Body size and metabolic rate. Physiological Reviews, 27, 511–541. https://doi.org/10.1152/physrev.1947.27.4.511 [3] Noël F., Karamaoun C., Dempsey J. A. and Mauroy B. (2021) The origin of the allometric scaling of lung's ventilation in mammals. arXiv, 2005.12362, ver. 6 peer-reviewed and recommended by Peer community in Mathematical and Computational Biology. https://arxiv.org/abs/2005.12362 [4] Otis AB, Fenn WO, Rahn H (1950) Mechanics of Breathing in Man. Journal of Applied Physiology, 2, 592–607. https://doi.org/10.1152/jappl.1950.2.11.592 [5] Noël F, Mauroy B (2019) Interplay Between Optimal Ventilation and Gas Transport in a Model of the Human Lung. Frontiers in Physiology, 10, 488. https://doi.org/10.3389/fphys.2019.00488 [6] Sapoval B, Filoche M, Weibel ER (2002) Smaller is better—but not too small: A physical scale for the design of the mammalian pulmonary acinus. Proceedings of the National Academy of Sciences, 99, 10411–10416. https://doi.org/10.1073/pnas.122352499 | The origin of the allometric scaling of lung ventilation in mammals | Frédérique Noël, Cyril Karamaoun, Jerome A. Dempsey, Benjamin Mauroy | <p>A model of optimal control of ventilation has recently been developed for humans. This model highlights the importance of the localization of the transition between a convective and a diffusive transport of respiratory gas. This localization de... | | Biophysics, Evolutionary Biology, Physiology | Wolfram Liebermeister | 2020-08-28 15:18:03 | ||
26 May 2021
An efficient algorithm for estimating population history from genetic dataAn efficient implementation of legofit software to infer demographic histories from population genetic dataRecommended by Matteo Fumagalli based on reviews by Fernando Racimo and 1 anonymous reviewer
The estimation of demographic parameters from population genetic data has been the subject of many scientific studies [1]. Among these efforts, legofit was firstly proposed in 2019 as a tool to infer size changes, subdivision and gene flow events from patterns of nucleotidic variation [2]. The first release of legofit used a stochastic algorithm to fit population parameters to the observed data. As it requires simulations to evaluate the fitting of each model, it is computationally intensive and can only be deployed on high-performance computing clusters. To overcome this issue, Rogers proposes a new implementation of legofit based on a deterministic algorithm that allows the estimation of demographic histories to be computationally faster and more accurate [3]. The new algorithm employs a continuous-time Markov chain that traces the ancestry of each sample into the past. The calculations are now divided into two steps, the first one being solved numerically. To test the hypothesis that the new implementation of legofit produces a more desirable performance, Rogers generated extensive simulations of genomes from African, European, Neanderthal and Denisovan populations with msprime [4]. Additionally, legofit was tested on real genetic data from samples of said populations, following a previously published study [5]. Based on simulations, the new deterministic algorithm is more than 1600 times faster than the previous stochastic model. Notably, the new version of legofit produces smaller residual errors, although the overall accuracy to estimate population parameters is comparable to the one obtained using the stochastic algorithm. When applied to real data, the new implementation of legofit was able to recapitulate previous findings of a complex demographic model with early gene flow from humans to Neanderthal [5]. Notably, the new implementation generates better discrimination between models, therefore leading to a better precision at predicting the population history. Some parameters estimated from real data point towards unrealistic scenarios, suggesting that the initial model could be misspecified. Further research is needed to fully explore the parameter range that can be evaluated by legofit, and to clarify the source of any associated bias. Additionally, the inclusion of data uncertainty in parameter estimation and model selection may be required to apply legofit to low-coverage high-throughput sequencing data [6]. Nevertheless, legofit is an efficient, accessible and user-friendly software to infer demographic parameters from genetic data and can be widely applied to test hypotheses in evolutionary biology. The new implementation of legofit software is freely available at https://github.com/alanrogers/legofit. References [1] Spence JP, Steinrücken M, Terhorst J, Song YS (2018) Inference of population history using coalescent HMMs: review and outlook. Current Opinion in Genetics & Development, 53, 70–76. https://doi.org/10.1016/j.gde.2018.07.002 [2] Rogers AR (2019) Legofit: estimating population history from genetic data. BMC Bioinformatics, 20, 526. https://doi.org/10.1186/s12859-019-3154-1 [3] Rogers AR (2021) An Efficient Algorithm for Estimating Population History from Genetic Data. bioRxiv, 2021.01.23.427922, ver. 5 peer-reviewed and recommended by Peer community in Mathematical and Computational Biology. https://doi.org/10.1101/2021.01.23.427922 [4] Kelleher J, Etheridge AM, McVean G (2016) Efficient Coalescent Simulation and Genealogical Analysis for Large Sample Sizes. PLOS Computational Biology, 12, e1004842. https://doi.org/10.1371/journal.pcbi.1004842 [5] Rogers AR, Harris NS, Achenbach AA (2020) Neanderthal-Denisovan ancestors interbred with a distantly related hominin. Science Advances, 6, eaay5483. https://doi.org/10.1126/sciadv.aay5483 [6] Soraggi S, Wiuf C, Albrechtsen A (2018) Powerful Inference with the D-Statistic on Low-Coverage Whole-Genome Data. G3 Genes|Genomes|Genetics, 8, 551–566. https://doi.org/10.1534/g3.117.300192 | An efficient algorithm for estimating population history from genetic data | Alan R. Rogers | <p style="text-align: justify;">The Legofit statistical package uses genetic data to estimate parameters describing population history. Previous versions used computer simulations to estimate probabilities, an approach that limited both speed and ... | | Combinatorics, Genetics and population Genetics | Matteo Fumagalli | 2021-01-26 20:04:35 | ||
27 Jul 2021
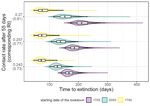
Estimating dates of origin and end of COVID-19 epidemicsThe importance of model assumptions in estimating the dynamics of the COVID-19 epidemicRecommended by Valery Forbes based on reviews by Bastien Boussau and 1 anonymous reviewerIn “Estimating dates of origin and end of COVID-19 epidemics”, Bénéteau et al. develop and apply a mathematical modeling approach to estimate the date of the origin of the SARS-CoV-2 epidemic in France. They also assess how long strict control measures need to last to ensure that the prevalence of the virus remains below key public health thresholds. This problem is challenging because the numbers of infected individuals in both tails of the epidemic are low, which can lead to errors when deterministic models are used. To achieve their goals, the authors developed a discrete stochastic model. The model is non-Markovian, meaning that individual infection histories influence the dynamics. The model also accounts for heterogeneity in the timing between infection and transmission and includes stochasticity as well as consideration of superspreader events. By comparing the outputs of their model with several alternative models, Bénéteau et al. were able to assess the importance of stochasticity, individual heterogeneity, and non-Markovian effects on the estimates of the dates of origin and end of the epidemic, using France as a test case. Some limitations of the study, which the authors acknowledge, are that the time from infection to death remains largely unknown, a lack of data on the heterogeneity of transmission among individuals, and the assumption that only a single infected individual caused the epidemic. Despite the acknowledged limitations of the work, the results suggest that cases may be detected long before the detection of an epidemic wave. Also, the approach may be helpful for informing public health decisions such as the necessary duration of strict lockdowns and for assessing the risks of epidemic rebound as restrictions are lifted. In particular, the authors found that estimates of the end of the epidemic following lockdowns are more sensitive to the assumptions of the models used than estimates of its beginning. In summary, this model adds to a valuable suite of tools to support decision-making in response to disease epidemics. References Bénéteau T, Elie B, Sofonea MT, Alizon S (2021) Estimating dates of origin and end of COVID-19 epidemics. medRxiv, 2021.01.19.21250080, ver. 3 peer-reviewed and recommended by Peer Community in Mathematical and Computational Biology. https://doi.org/10.1101/2021.01.19.21250080 | Estimating dates of origin and end of COVID-19 epidemics | Thomas Bénéteau, Baptiste Elie, Mircea T. Sofonea, Samuel Alizon | <p style="text-align: justify;">Estimating the date at which an epidemic started in a country and the date at which it can end depending on interventions intensity are important to guide public health responses. Both are potentially shaped by simi... | | Epidemiology, Probability and statistics, Stochastic dynamics | Valery Forbes | 2021-02-23 16:37:32 |


