
Latest recommendations

| Id | Title | Authors | Abstract | Picture▲ | Thematic fields | Recommender | Reviewers | Submission date | |
|---|---|---|---|---|---|---|---|---|---|
12 Oct 2023
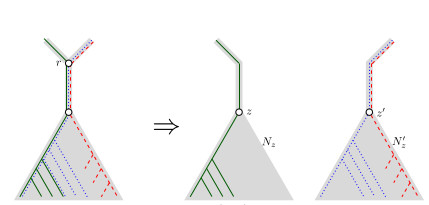
When Three Trees Go to WarBounding the reticulation number for three phylogenetic treesRecommended by Simone Linz based on reviews by Guillaume Scholz and Stefan GrünewaldReconstructing a phylogenetic network for a set of conflicting phylogenetic trees on the same set of leaves remains an active strand of research in mathematical and computational phylogenetic since 2005, when Baroni et al. [1] showed that the minimum number of reticulations h(T,T') needed to simultaneously embed two rooted binary phylogenetic trees T and T' into a rooted binary phylogenetic network is one less than the size of a maximum acyclic agreement forest for T and T'. In the same paper, the authors showed that h(T,T') is bounded from above by n-2, where n is the number of leaves of T and T' and that this bound is sharp. That is, for a fixed n, there exist two rooted binary phylogenetic trees T and T' such that h(T,T')=n-2. Since 2005, many papers have been published that develop exact algorithms and heuristics to solve the above NP-hard minimisation problem in practice, which is often referred to as Minimum Hybridisation in the literature, and that further investigate the mathematical underpinnings of Minimum Hybridisation and related problems. However, many such studies are restricted to two trees and much less is known about Minimum Hybridisation for when the input consists of more than two phylogenetic trees, which is the more relevant cases from a biological point of view. In [2], van Iersel, Jones, and Weller establish the first lower bound for the minimum reticulation number for more than two rooted binary phylogenetic trees, with a focus on exactly three trees. The above-mentioned connection between the minimum number of reticulations and maximum acyclic agreement forests does not extend to three (or more) trees. Instead, to establish their result, the authors use multi-labelled trees as an intermediate structure between phylogenetic trees and phylogenetic networks to show that, for each ε>0, there exist three caterpillar trees on n leaves such that any phylogenetic network that simultaneously embeds these three trees has at least (3/2 - ε)n reticulations. Perhaps unsurprising, caterpillar trees were also used by Baroni et al. [1] to establish that their upper bound on h(T,T') is sharp. Structurally, these trees have the property that each internal vertex is adjacent to a leaf. Each caterpillar tree can therefore be viewed as a sequence of characters, and it is exactly this viewpoint that is heavily used in [2]. More specifically, sequences with short common subsequences correspond to caterpillar trees that need many reticulations when embedded in a phylogenetic network. It would consequently be interesting to further investigate connections between caterpillar trees and certain types of sequences. Can they be used to shed more light on bounds for the minimum reticulation number? References [1] Baroni, M., Grünewald, S., Moulton, V., and Semple, C. (2005) "Bounding the number of hybridisation events for a consistent evolutionary history". J. Math. Biol. 51, 171–182. https://doi.org/10.1007/s00285-005-0315-9 | When Three Trees Go to War | Leo van Iersel and Mark Jones and Mathias Weller | <p style="text-align: justify;">How many reticulations are needed for a phylogenetic network to display a given set of k phylogenetic trees on n leaves? For k = 2, Baroni, Semple, and Steel [Ann. Comb. 8, 391-408 (2005)] showed that the answer is ... | | Combinatorics, Evolutionary Biology, Graph theory | Simone Linz | 2023-03-07 18:49:21 | ||
07 Sep 2021
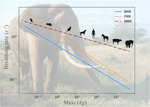
The origin of the allometric scaling of lung ventilation in mammalsHow mammals adapt their breath to body activity – and how this depends on body sizeRecommended by Wolfram Liebermeister based on reviews by Elad Noor, Oliver Ebenhöh, Stefan Schuster and Megumi InoueHow fast and how deep do animals breathe, and how does this depend on how active they are? To answer this question, one needs to dig deeply into how breathing works and what biophysical processes it involves. And one needs to think about body size. It is impressive how nature adapts the same body plan – e.g. the skeletal structure of mammals – to various shapes and sizes. From mice to whales, also the functioning of most organs remains the same; they are just differently scaled. Scaling does not just mean “making bigger or smaller”. As already noted by Galilei, body shapes change as they are adapted to body dimensions, and the same holds for physiological variables. Many such variables, for instance, heartbeat rates, follow scaling laws of the form y~x^a, where x denotes body mass and the exponent a is typically a multiple of ¼ [1]. These unusual exponents – instead of multiples of ⅓, which would be expected from simple geometrical scaling – are why these laws are called “allometric”. Kleiber’s law for metabolic rates, with a scaling exponent of ¾, is a classic example [2]. As shown by G. West, allometric laws can be explained through a few simple steps [1]. In his models, he focused on network-like organs such as the vascular system and assumed that these systems show a self-similar structure, with a fixed minimal unit (for instance, capillaries) but varying numbers of hierarchy levels depending on body size. To determine the flow through such networks, he employed biophysical models and optimality principles (for instance, assuming that oxygen must be transported at a minimal mechanical effort), and showed that the solutions – and the physiological variables – respect the known scaling relations. The paper “The origin of the allometric scaling of lung ventilation in mammals“ by Noël et al. [3], applies this thinking to the depth and rate of breathing in mammals. Scaling laws describing breathing in resting animals have been known since the 1950s [4], with exponents of 1 (for tidal volume) and -¼ (for breathing frequency). Equipped with a detailed biophysical model, Noël et al. revisit this question, extending these laws to other metabolic regimes. Their starting point is a model of the human lung, developed previously by two of the authors [5], which assumes that we meet our oxygen demand with minimal lung movements. To state this as an optimization problem, the model combines two submodels: a mechanical model describing the energetic effort of ventilation and a highly detailed model of convection and diffusion in self-similar lung geometries. Breathing depths and rates are computed by numerical optimization, and to obtain results for mammals of any size many of the model parameters are described by known scaling laws. As expected, the depth of breathing (measured by tidal volume) scales almost proportionally with body mass and increases with metabolic demand, while the breathing rate decreases with body mass, with an exponent of about -¼. However, the laws for the breathing rate hold only for basal activity; at higher metabolic rates, which are modeled here for the first time, the exponent deviates strongly from this value, in line with empirical data. Why is this paper important? The authors present a highly complex model of lung physiology that integrates a wide range of biophysical details and passes a difficult test: the successful prediction of unexplained scaling exponents. These scaling relations may help us transfer insights from animal models to humans and in reverse: data for breathing during exercise, which are easy to measure in humans, can be extrapolated to other species. Aside from the scaling laws, the model also reveals physiological mechanisms. In the larger lung branches, oxygen is transported mainly by air movement (convection), while in smaller branches air flow is slow and oxygen moves by diffusion. The transition between these regimes can occur at different depths in the lung: as the authors state, “the localization of this transition determines how ventilation should be controlled to minimize its energetic cost at any metabolic regime”. In the model, the optimal location for the transition depends on oxygen demand [5, 6]: the transition occurs deeper in the lung in exercise regimes than at rest, allowing for more oxygen to be taken up. However, the effects of this shift depend on body size: while small mammals generally use the entire exchange surface of their lungs, large mammals keep a reserve for higher activities, which becomes accessible as their transition zone moves at high metabolic rates. Hence, scaling can entail qualitative differences between species! Altogether, the paper shows how the dynamics of ventilation depend on lung morphology. But this may also play out in the other direction: if energy-efficient ventilation depends on body activity, and therefore on ecological niches, a niche may put evolutionary pressures on lung geometry. Hence, by understanding how deep and fast animals breathe, we may also learn about how behavior, physiology, and anatomy co-evolve. References [1] West GB, Brown JH, Enquist BJ (1997) A General Model for the Origin of Allometric Scaling Laws in Biology. Science 276 (5309), 122–126. https://doi.org/10.1126/science.276.5309.122 [2] Kleiber M (1947) Body size and metabolic rate. Physiological Reviews, 27, 511–541. https://doi.org/10.1152/physrev.1947.27.4.511 [3] Noël F., Karamaoun C., Dempsey J. A. and Mauroy B. (2021) The origin of the allometric scaling of lung's ventilation in mammals. arXiv, 2005.12362, ver. 6 peer-reviewed and recommended by Peer community in Mathematical and Computational Biology. https://arxiv.org/abs/2005.12362 [4] Otis AB, Fenn WO, Rahn H (1950) Mechanics of Breathing in Man. Journal of Applied Physiology, 2, 592–607. https://doi.org/10.1152/jappl.1950.2.11.592 [5] Noël F, Mauroy B (2019) Interplay Between Optimal Ventilation and Gas Transport in a Model of the Human Lung. Frontiers in Physiology, 10, 488. https://doi.org/10.3389/fphys.2019.00488 [6] Sapoval B, Filoche M, Weibel ER (2002) Smaller is better—but not too small: A physical scale for the design of the mammalian pulmonary acinus. Proceedings of the National Academy of Sciences, 99, 10411–10416. https://doi.org/10.1073/pnas.122352499 | The origin of the allometric scaling of lung ventilation in mammals | Frédérique Noël, Cyril Karamaoun, Jerome A. Dempsey, Benjamin Mauroy | <p>A model of optimal control of ventilation has recently been developed for humans. This model highlights the importance of the localization of the transition between a convective and a diffusive transport of respiratory gas. This localization de... | | Biophysics, Evolutionary Biology, Physiology | Wolfram Liebermeister | 2020-08-28 15:18:03 | ||
09 Nov 2023
A mechanistic-statistical approach to infer dispersal and demography from invasion dynamics, applied to a plant pathogenA mechanistic-statistical approach for the field-based study of invasion dynamicsRecommended by Hirohisa Kishino based on reviews by 2 anonymous reviewers based on reviews by 2 anonymous reviewers
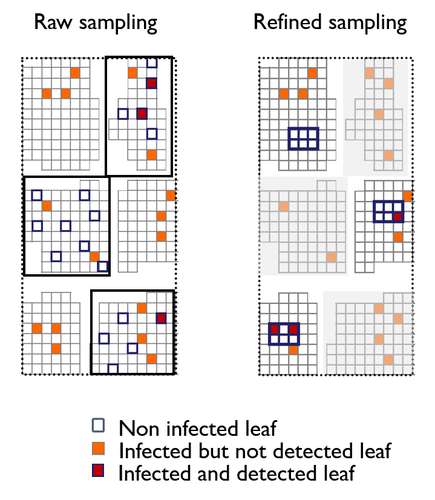
To study the annual invasion of a tree pathogen (Melampsora larici-populina, a fungal species responsible for the poplar rust disease), Xhaard et al (2012) had conducted a spatiotemporal survey along the Durance River valley in the French Alps over nearly 200 km, measuring sampled leaves and twigs from 40 to 150 trees at 12 evenly spaced study sites at seven-time points. By combining Bayesian genetic assignment and a landscape epidemiology approach, they were able to estimate the genetic origin and annual spread of the plant pathogen during a single epidemic. The observed temporal variation in the spatial pattern of infection rates allowed Saubin et al (2023) to estimate the key factors that determine the speed of the invasion dynamics. In particular, it is crucial to estimate the probability and extent of long-distance dispersal. The dynamics of the macroscale population density was formulated by the reaction-diffusion (R.D.) model and by the integro-difference (I.D.) model. Both consist of the diffusion/dispersal component and the reaction component. In the I.D. model, the kernel function represents the distribution of the dispersion. The likelihood function was obtained by coupling the mathematical model of the population dynamics and the statistical model of the observational process. Saubin et al (2023) considered a thin-tailed Gaussian kernel, a heavy-tailed exponential kernel, and a fat-tailed exponential power kernel. The numerical simulation reflecting the above survey confirmed the identifiability of the propagation kernel and the accuracy of the parameter estimation. In particular, the above survey had the high power to identify the model with frequent long-distance dispersal. The data from the survey selected the exponential power kernel with confidence. The mean dispersal distance was estimated to be 2.01 km. The exponential power was 0.24. This parameter value predicts that 5% of the dispersals will have a distance > 14.3 km and 1% will have a distance > 36.0 km. The mechanistic-statistical approach presented here may become a new standard for the field-based studies of invasion dynamics. References Saubin, M., Coville, J., Xhaard, C., Frey, P., Soubeyrand, S., Halkett, F., and Fabre, F. (2023). A mechanistic-statistical approach to infer dispersal and demography from invasion dynamics, applied to a plant pathogen. bioRxiv, ver. 5 peer-reviewed and recommended by Peer Community in Mathematical and Computational Biology. https://doi.org/10.1101/2023.03.21.533642 Xhaard, C., Barrès, B., Andrieux, A., Bousset, L., Halkett, F., and Frey, P. (2012). Disentangling the genetic origins of a plant pathogen during disease spread using an original molecular epidemiology approach. Molecular Ecology, 21(10):2383-2398. https://doi.org/10.1111/j.1365-294X.2012.05556.x | A mechanistic-statistical approach to infer dispersal and demography from invasion dynamics, applied to a plant pathogen | Méline Saubin, Jérome Coville, Constance Xhaard, Pascal Frey, Samuel Soubeyrand, Fabien Halkett, Frédéric Fabre | <p style="text-align: justify;">Dispersal, and in particular the frequency of long-distance dispersal (LDD) events, has strong implications for population dynamics with possibly the acceleration of the colonisation front, and for evolution with po... | | Dynamical systems, Ecology, Epidemiology, Probability and statistics | Hirohisa Kishino | 2023-05-10 09:57:25 | ||
27 Jul 2021
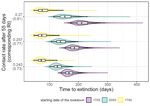
Estimating dates of origin and end of COVID-19 epidemicsThe importance of model assumptions in estimating the dynamics of the COVID-19 epidemicRecommended by Valery Forbes based on reviews by Bastien Boussau and 1 anonymous reviewerIn “Estimating dates of origin and end of COVID-19 epidemics”, Bénéteau et al. develop and apply a mathematical modeling approach to estimate the date of the origin of the SARS-CoV-2 epidemic in France. They also assess how long strict control measures need to last to ensure that the prevalence of the virus remains below key public health thresholds. This problem is challenging because the numbers of infected individuals in both tails of the epidemic are low, which can lead to errors when deterministic models are used. To achieve their goals, the authors developed a discrete stochastic model. The model is non-Markovian, meaning that individual infection histories influence the dynamics. The model also accounts for heterogeneity in the timing between infection and transmission and includes stochasticity as well as consideration of superspreader events. By comparing the outputs of their model with several alternative models, Bénéteau et al. were able to assess the importance of stochasticity, individual heterogeneity, and non-Markovian effects on the estimates of the dates of origin and end of the epidemic, using France as a test case. Some limitations of the study, which the authors acknowledge, are that the time from infection to death remains largely unknown, a lack of data on the heterogeneity of transmission among individuals, and the assumption that only a single infected individual caused the epidemic. Despite the acknowledged limitations of the work, the results suggest that cases may be detected long before the detection of an epidemic wave. Also, the approach may be helpful for informing public health decisions such as the necessary duration of strict lockdowns and for assessing the risks of epidemic rebound as restrictions are lifted. In particular, the authors found that estimates of the end of the epidemic following lockdowns are more sensitive to the assumptions of the models used than estimates of its beginning. In summary, this model adds to a valuable suite of tools to support decision-making in response to disease epidemics. References Bénéteau T, Elie B, Sofonea MT, Alizon S (2021) Estimating dates of origin and end of COVID-19 epidemics. medRxiv, 2021.01.19.21250080, ver. 3 peer-reviewed and recommended by Peer Community in Mathematical and Computational Biology. https://doi.org/10.1101/2021.01.19.21250080 | Estimating dates of origin and end of COVID-19 epidemics | Thomas Bénéteau, Baptiste Elie, Mircea T. Sofonea, Samuel Alizon | <p style="text-align: justify;">Estimating the date at which an epidemic started in a country and the date at which it can end depending on interventions intensity are important to guide public health responses. Both are potentially shaped by simi... | | Epidemiology, Probability and statistics, Stochastic dynamics | Valery Forbes | 2021-02-23 16:37:32 | ||
10 Apr 2024
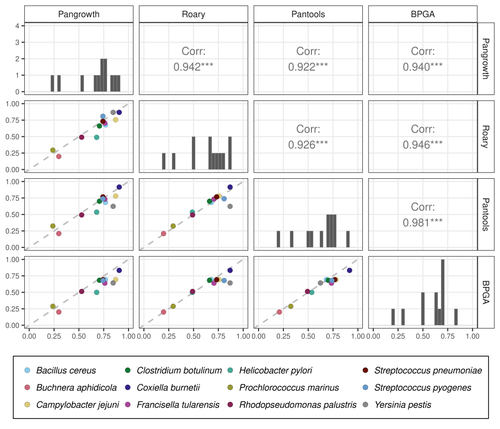
Revisiting pangenome openness with k-mersFaster method for estimating the openness of speciesRecommended by Leo van Iersel based on reviews by Guillaume Marçais, Abiola Akinnubi and 1 anonymous reviewerWhen sequencing more and more genomes of a species (or a group of closely related species), a natural question to ask is how quickly the total number of distinct sequences grows as a function of the total number of sequenced genomes. A similar question can be asked about the number of distinct genes or the number of distinct k-mers (length-k subsequences). References [1] Parmigiani L., Wittler, R. and Stoye, J. (2024) "Revisiting pangenome openness with k-mers". bioRxiv, ver. 4 peer-reviewed and recommended by Peer Community In Mathematical and Computational Biology. https://doi.org/10.1101/2022.11.15.516472 | Revisiting pangenome openness with k-mers | Luca Parmigiani, Roland Wittler, Jens Stoye | <p style="text-align: justify;">Pangenomics is the study of related genomes collectively, usually from the same species or closely related taxa. Originally, pangenomes were defined for bacterial species. After the concept was extended to eukaryoti... | | Combinatorics, Genomics and Transcriptomics | Leo van Iersel | Guillaume Marçais, Yadong Zhang | 2022-11-22 14:48:18 | |
02 May 2023
Population genetics: coalescence rate and demographic parameters inferenceEstimates of Effective Population Size in Subdivided PopulationsRecommended by Alan Rogers based on reviews by 2 anonymous reviewers
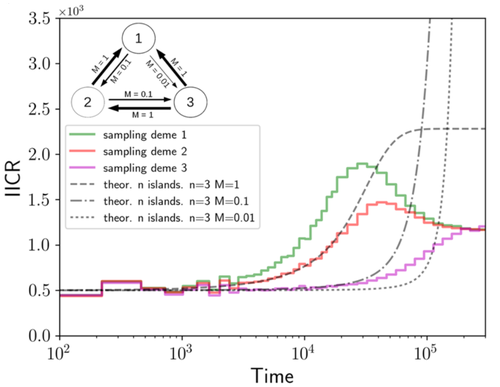
We often use genetic data from a single site, or even a single individual, to estimate the history of effective population size, Ne, over time scales in excess of a million years. Mazet and Noûs [2] emphasize that such estimates may not mean what they seem to mean. The ups and downs of Ne may reflect changes in gene flow or selection, rather than changes in census population size. In fact, gene flow may cause Ne to decline even if the rate of gene flow has remained constant. Consider for example the estimates of archaic population size in Fig. 1, which show an apparent decline in population size between roughly 700 kya and 300 kya. It is tempting to interpret this as evidence of a declining number of individuals, but that is not the only plausible interpretation. Each of these estimates is based on the genome of a single diploid individual. As we trace the ancestry of that individual backwards into the past, the ancestors are likely to remain in the same locale for at least a generation or two. Being neighbors, there’s a chance they will mate. This implies that in the recent past, the ancestors of a sampled individual lived in a population of small effective size. As we continue backwards into the past, there is more and more time for the ancestors to move around on the landscape. The farther back we go, the less likely they are to be neighbors, and the less likely they are to mate. In this more remote past, the ancestors of our sample lived in a population of larger effective size, even if neither the number of individuals nor the rate of gene flow has changed. For awhile then, Ne should increase as we move backwards into the past. This process does not continue forever, because eventually the ancestors will be randomly distributed across the population as a whole. We therefore expect Ne to increase towards an asymptote, which represents the effective size of the entire population. This simple story gets more complex if there is change in either the census size or the rate of gene flow. Mazet and Noûs [2] have shown that one can mimic real estimates of population history using models in which the rate of gene flow varies, but census size does not. This implies that the curves in Fig. 1 are ambiguous. The observed changes in Ne could reflect changes in census size, gene flow, or both. For this reason, Mazet and Noûs [2] would like to replace the term “effective population size” with an alternative, the “inverse instantaneous coalescent rate,” or IIRC. I don’t share this preference, because the same critique could be made of all definitions of Ne. For example, Wright [3, p. 108] showed in 1931 that Ne varies in response to the sex ratio, and this implies that changes in Ne need not involve any change in census size. This is also true when populations are geographically structured, as Mazet and Noûs [2] have emphasized, but this does not seem to require a new vocabulary.
Figure 1: PSMC estimates of the history of population size based on three archaic genomes: two Neanderthals and a Denisovan [1]. Mazet and Noûs [2] also show that estimates of Ne can vary in response to selection. It is not hard to see why such an effect might exist. In genomic regions affected by directional or purifying selection, heterozygosity is low, and common ancestors tend to be recent. Such regions may contribute to small estimates of recent Ne. In regions under balancing selection, heterozygosity is high, and common ancestors tend to be ancient. Such regions may contribute to large estimates of ancient Ne. The magnitude of this effect presumably depends on the fraction of the genome under selection and the rate of recombination. In summary, this article describes several processes that can affect estimates of the history of effective population size. This makes existing estimates ambiguous. For example, should we interpret Fig. 1 as evidence of a declining number of archaic individuals, or in terms of gene flow among archaic subpopulations? But these questions also present research opportunities. If the observed decline reflects gene flow, what does this imply about the geographic structure of archaic populations? Can we resolve the ambiguity by integrating samples from different locales, or using archaeological estimates of population density or interregional trade? REFERENCES [1] Fabrizio Mafessoni et al. “A high-coverage Neandertal genome from Chagyrskaya Cave”. Proceedings of the National Academy of Sciences, USA 117.26 (2020), pp. 15132–15136. https://doi.org/10.1073/pnas.2004944117. [2] Olivier Mazet and Camille Noûs. “Population genetics: coalescence rate and demographic parameters inference”. arXiv, ver. 2 peer-reviewed and recommended by Peer Community In Mathematical and Computational Biology (2023). https://doi.org/10.48550/ARXIV.2207.02111. [3] Sewall Wright. “Evolution in mendelian populations”. Genetics 16 (1931), pp. 97–159. https://doi.org/10.48550/ARXIV.2207.0211110.1093/genetics/16.2.97. | Population genetics: coalescence rate and demographic parameters inference | Olivier Mazet, Camille Noûs | <p style="text-align: justify;">We propose in this article a brief description of the work, over almost a decade, resulting from a collaboration between mathematicians and biologists from four different research laboratories, identifiable as the c... | | Genetics and population Genetics, Probability and statistics | Alan Rogers | Joseph Lachance, Anonymous | 2022-07-11 14:03:04 | |
26 Feb 2024
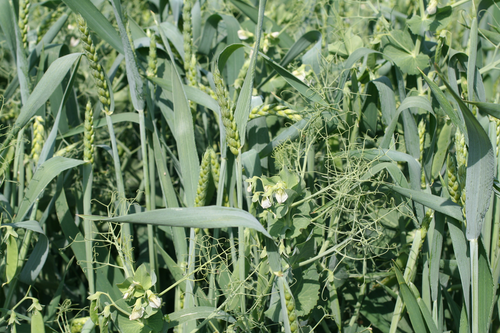
A workflow for processing global datasets: application to intercroppingCollecting, assembling and sharing data in crop sciencesRecommended by Eric Tannier based on reviews by Christine Dillmann and 2 anonymous reviewers
It is often the case that scientific knowledge exists but is scattered across numerous experimental studies. Because of this dispersion in different formats, it remains difficult to access, extract, reproduce, confirm or generalise. This is the case in crop science, where Mahmoud et al [1] propose to collect and assemble data from numerous field experiments on intercropping. It happens that the construction of the global dataset requires a lot of time, attention and a well thought-out method, inspired by the literature on data science [2] and adapted to the specificities of crop science. This activity also leads to new possibilities that were not available in individual datasets, such as the detection of full factorial designs using graph theory tools developed on top of the global dataset. The study by Mahmoud et al [1] has thus multiple dimensions:
I was particularly interested in the promotion of the FAIR principles, perhaps used a little too uncritically in my view, as an obvious solution to data sharing. On the one hand, I am admiring and grateful for the availability of these data, some of which have never been published, nor associated with published results. This approach is likely to unearth buried treasures. On the other hand, I can understand the reluctance of some data producers to commit to total, definitive sharing, facilitating automatic reading, without having thought about a certain reciprocity on the part of users and use by artificial intelligence. Reciprocity in terms of recognition, as is discussed by Mahmoud et al [1], but also in terms of contribution to the commons [5] or reading conditions for machine learning. References [1] Mahmoud R., Casadebaig P., Hilgert N., Gaudio N. A workflow for processing global datasets: application to intercropping. 2024. ⟨hal-04145269v2⟩ ver. 2 peer-reviewed and recommended by Peer Community in Mathematical and Computational Biology. https://hal.science/hal-04145269 [2] Wickham, H. 2014. Tidy data. Journal of Statistical Software 59(10) https://doi.org/10.18637/jss.v059.i10 [3] Gaudio, N., R. Mahmoud, L. Bedoussac, E. Justes, E.-P. Journet, et al. 2023. A global dataset gathering 37 field experiments involving cereal-legume intercrops and their corresponding sole crops. https://doi.org/10.5281/zenodo.8081577 [4] Mahmoud, R., Casadebaig, P., Hilgert, N. et al. Species choice and N fertilization influence yield gains through complementarity and selection effects in cereal-legume intercrops. Agron. Sustain. Dev. 42, 12 (2022). https://doi.org/10.1007/s13593-022-00754-y [5] Bernault, C. « Licences réciproques » et droit d'auteur : l'économie collaborative au service des biens communs ?. Mélanges en l'honneur de François Collart Dutilleul, Dalloz, pp.91-102, 2017, 978-2-247-17057-9. https://shs.hal.science/halshs-01562241 | A workflow for processing global datasets: application to intercropping | Rémi Mahmoud, Pierre Casadebaig, Nadine Hilgert, Noémie Gaudio | <p>Field experiments are a key source of data and knowledge in agricultural research. An emerging practice is to compile the measurements and results of these experiments (rather than the results of publications, as in meta-analysis) into global d... | | Agricultural Science | Eric Tannier | 2023-06-29 15:38:28 | ||
10 Jan 2024
An approximate likelihood method reveals ancient gene flow between human, chimpanzee and gorillaAphid: A Novel Statistical Method for Dissecting Gene Flow and Lineage Sorting in Phylogenetic ConflictRecommended by Alan Rogers based on reviews by Richard Durbin and 2 anonymous reviewers
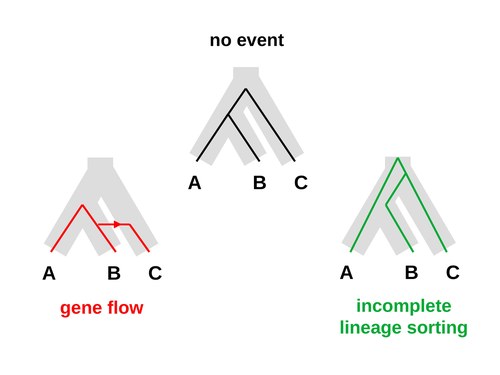
Galtier [1] introduces “Aphid,” a new statistical method that estimates the contributions of gene flow (GF) and incomplete lineage sorting (ILS) to phylogenetic conflict. Aphid is based on the observation that GF tends to make gene genealogies shorter, whereas ILS makes them longer. Rather than fitting the full likelihood, it models the distribution of gene genealogies as a mixture of several canonical gene genealogies in which coalescence times are set equal to their expectations under different models. This simplification makes Aphid far faster than competing methods. In addition, it deals gracefully with bidirectional gene flow—an impossibility under competing models. Because of these advantages, Aphid represents an important addition to the toolkit of evolutionary genetics. In the interest of speed, Aphid makes several simplifying assumptions. Yet even when these were violated, Aphid did well at estimating parameters from simulated data. It seems to be reasonably robust. Aphid studies phylogenetic conflict, which occurs when some loci imply one phylogenetic tree and other loci imply another. This happens when the interval between successive speciation events is fairly short. If this interval is too short, however, Aphid’s approximations break down, and its estimates are biased. Galtier suggests caution when the fraction of discordant phylogenetic trees exceeds 50–55%. Thus, Aphids will be most useful when the interval between speciation events is short, but not too short. Galtier applies the new method to three sets of primate data. In two of these data sets (baboons and African apes), Aphid detects gene flow that would likely be missed by competing methods. These competing methods are primarily sensitive to gene flow that is asymmetric in two senses: (1) greater flow in one direction than the other, and (2) unequal gene flow connecting an outgroup to two sister species. Aphid finds evidence of symmetric gene flow in the ancestry of baboons and also in that of African apes. The data suggest that ancestral humans and chimpanzees both interbred with ancestral gorillas, and at about the same rate. Aphid’s ability to detect this signature sets it apart from competing methods. References [1] Nicolas Galtier (2023) “An approximate likelihood method reveals ancient gene flow between human, chimpanzee and gorilla”. bioRxiv, ver. 3 peer-reviewed and recommended by Peer Community in Mathematical and Computational Biology. https://doi.org/10.1101/2023.07.06.547897 | An approximate likelihood method reveals ancient gene flow between human, chimpanzee and gorilla | Nicolas Galtier | <p>Gene flow and incomplete lineage sorting are two distinct sources of phylogenetic conflict, i.e., gene trees that differ in topology from each other and from the species tree. Distinguishing between the two processes is a key objective of curre... | | Evolutionary Biology, Genetics and population Genetics, Genomics and Transcriptomics | Alan Rogers | 2023-07-06 18:41:16 | ||
18 Apr 2023
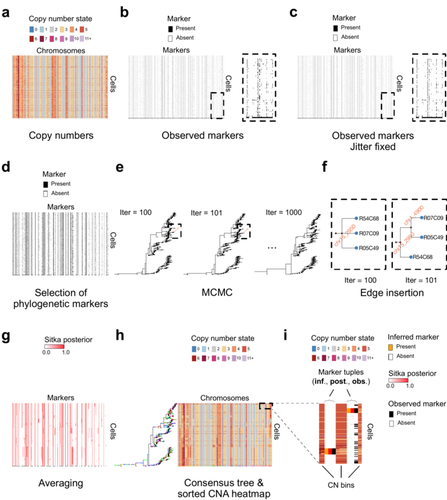
Cancer phylogenetic tree inference at scale from 1000s of single cell genomesPhylogenetic reconstruction from copy number aberration in large scale, low-depth genome-wide single-cell data.Recommended by Amaury Lambert based on reviews by 3 anonymous reviewersThe paper [1] presents and applies a new Bayesian inference method of phylogenetic reconstruction for multiple sequence alignments in the case of low sequencing coverage but diverse copy number aberrations (CNA), with applications to single cell sequencing of tumors. The idea is to take advantage of CNA to reconstruct the topology of the phylogenetic tree of sequenced cells in a first step (the `sitka' method), and in a second step to assign single nucleotide variants (SNV) to tree edges (and then calibrate their lengths) (the `sitka-snv' method). The data are summarized into a binary-valued CxL matrix Y, where C is the number of cells and L is the number of loci (here, loci are segments of prescribed length called `bins'). The entry of Y at row i and column j is 1 (otherwise 0) iff in the ancestral lineage of cell i, at least one genomic rearrangement has occurred, and more specifically the gain or loss of a segment with at least one endpoint in locus j or in locus j+1. The authors expect the infinite-allele assumption to approximately hold (i.e., that at most one mutation occurs at any given marker and that 0 is the ancestral state). They refer to this assumption as the `perfect phylogeny assumption'. By only recording from CNA events the endpoints at which they occur, the authors lose the information on copy number, but they gain the assumption of independence of the mutational processes occurring at different sites, which approximately holds for CNA endpoints. The goal of sitka is to produce a posterior distribution on phylogenetic trees conditional on the matrix Y , where here a phylogenetic tree is understood as containing the information on 1) the topology of the tree but not its edge lengths, and 2) for each edge, the identity of markers having undergone a mutation, in the sense of the previous paragraph. The results of the method are tested against synthetic datasets simulated under various assumptions, including conditions violating the perfect phylogeny assumption and compared to results obtained under other baseline methods. The method is extended to assign SNV to edges of the tree inferred by sitka. It is also applied to real datasets of single cell genomes of tumors. The manuscript is very well-written, with a high degree of detail. The method is novel, scalable, fast and appears to perform favorably compared to other approaches. It has been applied in independent publications, for example to multi-year time-series single-cell whole-genome sequencing of tumors, in order to infer the fitness landscape and its dynamics through time, see [2]. The reviewing process has taken too long, mainly because of other commitments I had during the period and to the difficulty of finding reviewers. Let me apologize to the authors and thank them for their patience as well as for the scientific rigor they brought to their revisions and answers to reviewers, who I also warmly thank for their quality work. REFERENCES [1] Sohrab Salehi, Fatemeh Dorri, Kevin Chern, Farhia Kabeer, Nicole Rusk, Tyler Funnell, Marc J Williams, Daniel Lai, Mirela Andronescu, Kieran R. Campbell, Andrew McPherson, Samuel Aparicio, Andrew Roth, Sohrab Shah, and Alexandre Bouchard-Côté. Cancer phylogenetic tree inference at scale from 1000s of single cell genomes (2023). bioRxiv, 2020.05.06.058180, ver. 4 peer-reviewed and recommended by Peer Community in Mathematical and Computational Biology. [2] Sohrab Salehi, Farhia Kabeer, Nicholas Ceglia, Mirela Andronescu, Marc J. Williams, Kieran R. Campbell, Tehmina Masud, Beixi Wang, Justina Biele, Jazmine Brimhall, David Gee, Hakwoo Lee, Jerome Ting, Allen W. Zhang, Hoa Tran, Ciara O’Flanagan, Fatemeh Dorri, Nicole Rusk, Teresa Ruiz de Algara, So Ra Lee, Brian Yu Chieh Cheng, Peter Eirew, Takako Kono, Jenifer Pham, Diljot Grewal, Daniel Lai, Richard Moore, Andrew J. Mungall, Marco A. Marra, IMAXT Consortium, Andrew McPherson, Alexandre Bouchard-Côté, Samuel Aparicio & Sohrab P. Shah. Clonal fitness inferred from time-series modelling of single-cell cancer genomes (2021). Nature 595, 585–590. https://doi.org/10.1038/s41586-021-03648-3 | Cancer phylogenetic tree inference at scale from 1000s of single cell genomes | Sohrab Salehi, Fatemeh Dorri, Kevin Chern, Farhia Kabeer, Nicole Rusk, Tyler Funnell, Marc J Williams, Daniel Lai, Mirela Andronescu, Kieran R. Campbell, Andrew McPherson, Samuel Aparicio, Andrew Roth, Sohrab Shah, and Alexandre Bouchard-Côté | <p style="text-align: justify;">A new generation of scalable single cell whole genome sequencing (scWGS) methods allows unprecedented high resolution measurement of the evolutionary dynamics of cancer cell populations. Phylogenetic reconstruction ... | | Evolutionary Biology, Genetics and population Genetics, Genomics and Transcriptomics, Machine learning, Probability and statistics | Amaury Lambert | 2021-12-10 17:08:04 | ||
21 Feb 2022
Consistency of orthology and paralogy constraints in the presence of gene transfersAllowing gene transfers doesn't make life easier for inferring orthology and paralogyRecommended by Barbara Holland based on reviews by 2 anonymous reviewersDetermining if genes are orthologous (i.e. homologous genes whose most common ancestor represents a speciation) or paralogous (homologous genes whose most common ancestor represents a duplication) is a foundational problem in bioinformatics. For instance, the input to almost all phylogenetic methods is a sequence alignment of genes assumed to be orthologous. Understanding if genes are paralogs or orthologs can also be important for assigning function, for example genes that have diverged following duplication may be more likely to have neofunctionalised or subfunctionalised compared to genes that have diverged following speciation, which may be more likely to have continued in a similar role. This paper by Jones et al (2022) contributes to a wide range of literature addressing the inference of orthology/paralogy relations but takes a different approach to explaining inconsistency between an assumed species phylogeny and a relation graph (a graph where nodes represent genes and edges represent that the two genes are orthologs). Rather than assuming that inconsistencies are the result of incorrect assessment of orthology (i.e. incorrect edges in the relation graph) they ask if the relation graph could be consistent with a species tree combined with some amount of lateral (horizontal) gene transfer. The two main questions addressed in this paper are (1) if a network N and a relation graph R are consistent, and (2) if – given a species tree S and a relation graph R – transfer arcs can be added to S in such a way that it becomes consistent with R? The first question hinges on the concept of a reconciliation between a gene tree and a network (section 2.1) and amounts to asking if a gene tree can be found that can both be reconciled with the network and consistent with the relation graph. The authors show that the problem is NP hard. Furthermore, the related problem of attempting to find a solution using k or fewer transfers is NP-hard, and also W[1] hard implying that it is in a class of problems for which fixed parameter tractable solutions have not been found. The proof of NP hardness is by reduction to the k-multi-coloured clique problem via an intermediate problem dubbed “antichain on trees” (Section 3). The “antichain on trees” construction may be of interest to others working on algorithmic complexity with phylogenetic networks. In the second question the possible locations of transfers are not specified (or to put it differently any time consistent transfer arc is considered possible) and it is shown that it generally will be possible to add transfer edges to S in such a way that it can be consistent with R. However, the natural extension to this question of asking if it can be done with k or fewer added arcs is also NP hard. Many of the proofs in the paper are quite technical, but the authors have relegated a lot of this detail to the appendix thus ensuring that the main ideas and results are clear to follow in the main text. I am grateful to both reviewers for their detailed reviews and through checking of the proofs. References Jones M, Lafond M, Scornavacca C (2022) Consistency of orthology and paralogy constraints in the presence of gene transfers. arXiv:1705.01240 [cs], ver. 6 peer-reviewed and recommended by Peer Community in Mathematical and Computational Biology. https://arxiv.org/abs/1705.01240 | Consistency of orthology and paralogy constraints in the presence of gene transfers | Mark Jones, Manuel Lafond, Celine Scornavacca | <p style="text-align: justify;">Orthology and paralogy relations are often inferred by methods based on gene sequence similarity that yield a graph depicting the relationships between gene pairs. Such relation graphs frequently contain errors, as ... | | Computational complexity, Design and analysis of algorithms, Evolutionary Biology, Graph theory | Barbara Holland | 2021-06-30 15:01:44 |


