
Recommendation
 based on reviews by Fernando Racimo and 1 anonymous reviewer
The estimation of demographic parameters from population genetic data has been the subject of many scientific studies [1]. Among these efforts, legofit was firstly proposed in 2019 as a tool to infer size changes, subdivision and gene flow events from patterns of nucleotidic variation [2]. The first release of legofit used a stochastic algorithm to fit population parameters to the observed data. As it requires simulations to evaluate the fitting of each model, it is computationally intensive and can only be deployed on high-performance computing clusters.
To overcome this issue, Rogers proposes a new implementation of legofit based on a deterministic algorithm that allows the estimation of demographic histories to be computationally faster and more accurate [3]. The new algorithm employs a continuous-time Markov chain that traces the ancestry of each sample into the past. The calculations are now divided into two steps, the first one being solved numerically. To test the hypothesis that the new implementation of legofit produces a more desirable performance, Rogers generated extensive simulations of genomes from African, European, Neanderthal and Denisovan populations with msprime [4]. Additionally, legofit was tested on real genetic data from samples of said populations, following a previously published study [5].
Based on simulations, the new deterministic algorithm is more than 1600 times faster than the previous stochastic model. Notably, the new version of legofit produces smaller residual errors, although the overall accuracy to estimate population parameters is comparable to the one obtained using the stochastic algorithm. When applied to real data, the new implementation of legofit was able to recapitulate previous findings of a complex demographic model with early gene flow from humans to Neanderthal [5]. Notably, the new implementation generates better discrimination between models, therefore leading to a better precision at predicting the population history. Some parameters estimated from real data point towards unrealistic scenarios, suggesting that the initial model could be misspecified.
Further research is needed to fully explore the parameter range that can be evaluated by legofit, and to clarify the source of any associated bias. Additionally, the inclusion of data uncertainty in parameter estimation and model selection may be required to apply legofit to low-coverage high-throughput sequencing data [6]. Nevertheless, legofit is an efficient, accessible and user-friendly software to infer demographic parameters from genetic data and can be widely applied to test hypotheses in evolutionary biology. The new implementation of legofit software is freely available at https://github.com/alanrogers/legofit.
References
[1] Spence JP, Steinrücken M, Terhorst J, Song YS (2018) Inference of population history using coalescent HMMs: review and outlook. Current Opinion in Genetics & Development, 53, 70–76. https://doi.org/10.1016/j.gde.2018.07.002
[2] Rogers AR (2019) Legofit: estimating population history from genetic data. BMC Bioinformatics, 20, 526. https://doi.org/10.1186/s12859-019-3154-1
[3] Rogers AR (2021) An Efficient Algorithm for Estimating Population History from Genetic Data. bioRxiv, 2021.01.23.427922, ver. 5 peer-reviewed and recommended by Peer community in Mathematical and Computational Biology. https://doi.org/10.1101/2021.01.23.427922
[4] Kelleher J, Etheridge AM, McVean G (2016) Efficient Coalescent Simulation and Genealogical Analysis for Large Sample Sizes. PLOS Computational Biology, 12, e1004842. https://doi.org/10.1371/journal.pcbi.1004842
[5] Rogers AR, Harris NS, Achenbach AA (2020) Neanderthal-Denisovan ancestors interbred with a distantly related hominin. Science Advances, 6, eaay5483. https://doi.org/10.1126/sciadv.aay5483
[6] Soraggi S, Wiuf C, Albrechtsen A (2018) Powerful Inference with the D-Statistic on Low-Coverage Whole-Genome Data. G3 Genes|Genomes|Genetics, 8, 551–566. https://doi.org/10.1534/g3.117.300192
DOI or URL of the preprint: https://www.biorxiv.org/content/10.1101/2021.01.23.427922v2
, posted 02 Mar 2021Dear Professor Rogers,
your manuscript has been reviewed by two experts in the field. They both found your study worth of merit, useful and of interest. I agree with their assessment. However, they raise some questions which should be fully addressed before recommending this paper. For instance, several clarifications are sought on the simulations performed. Additionally, either a small application on real data or explicit comparison of run times between different versions of legofit will improve the appealing of this study. Please also fix any typos and inconsistencies (e.g. numbering of references). Additionally, I would encourage you to provide more details on the context of legofit for readers who are not familiar with the original paper, and to provide a more comprehensive abstract. Please provide a point-to-point letter to address all reviewers' comments.
I am looking forward to read a revised version of this manuscript.
Kind Regards,
Matteo Fumagalli
In this paper, the author presents a deterministic alternative to his previously developed approach to estimate historic demographic parameters from cross-population genetic samples. The original method was published and reviewed elsewhere (ref. 11). The most important feature of the deterministic algorithm presented here, which is based on exact combinatorics, is that it has a shorter runtime for non-complex models. The derivations of the exact deterministic computations are well described and the structure of this part of the manuscript makes it easy to read and understand. While I think the improved efficiency of the algorithm has been demonstrated sufficiently, some questions remain regarding the simulations as well as the utility of the method.
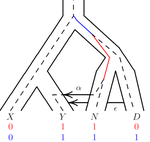
• It is stated that the simulation uses the gene genealogy of Fig. 1. Does this imply that individuals sampled from population Y can exclusively be migrants from populations N or D? • What is the assumed sample size (i.e. n) in the simulations? It is mentioned that there are ten times as many points as free parameters (p. 7), implying a sample size of around ten based on a statement in ref. 11. Why was this sample size chosen? • In Fig. 2, it is stated that the number of estimated parameters is 11, whereas, according to the supplemental file, the model has a total of 16 parameters that concern demography (i.e. population sizes, split times, migration rates). Are the five remaining parameters assumed to be known? Could they be estimated as well (e.g. time of Neanderthal admixture)? Or are they fixed to avoid unidentifiability of other parameters like e.g. the migration rates? Does the need to fix these important parameters (including also Nxy and Txynd) limit the applicability of the approach to relevant real-world scenarios? • How does the accuracy of the estimation of population sizes and split times depend on the migration rates (i.e. how robust are they under variation of migration rates)? • The described procedure to compute partitions among ancestors is carried out within segments of constant population size 2N. However, in the case of migration as depicted in Fig. 1, when looking backward in time a lineage leaves population Y and appears in population N. It has therefore evolved in a segment with population size 2NY until the time of admixture and "after" that it evolves in a segment of size 2NN. It is not clear to me how this dynamics is accounted for in the algorithm to compute the branch lengths of site patterns. • On p. 9, it is discussed how the observed correlations of estimated parameters (leading to non-identifiability) can be attempted to be ameliorated using PCA. However, it is mentioned that PCA introduces further bias and that therefore it is omitted here. I do not understand how, then, the correlations are corrected for instead. Also, what are stages 4 and 5 of the algorithm doing, as apparently there is still some kind of dimensionality reduction carried out in them. • In Fig. 3, since absolute differences in pattern frequencies are plotted, it is hard to assess the accuracy of the algorithm (besides the direct comparison between the two modes, stochastic vs. deterministic). I would recommend plotting relative errors instead. • Why is 2N repeatedly named the "haploid population size" (instead of N)? Conversely, in the supplement N is confusingly called the "di[p]loid population size". • What is the following parameter, mentioned in the supplemental file: "c = 1e-8 # rate per base pair per generation"? • Note that migration rates are denoted differently in Figs. 1 and 2.
https://doi.org/10.24072/pci.mcb.100036.rev11In this manuscript, Rogers provides a new procedure that makes one of his previously published methods for inferring demographic parameters from genomic data orders of magnitude faster. The algorithm relies on two improvements. One is the use of the matrix coalescent for deriving the probability that there are a certain number of ancestral lineages that subtend a given number of descendant lineages over a period of time, including a new way of factoring this model into 2 steps, which solves numerical issues associated with it. The other relies on the way descendant samples are partitioned among its possible ancestors. The new algorithm makes his previous legit method more widely applicable to biologists interested in demographic history who don't have access to large computer clusters. The mathematic derivations about probabilities of different number of descendants might also be useful in other coalescent-based inference methods.
I only have minor comments:
While individual subsections of the method section were clearly explained, I feel the connections between the different sections were a bit hard to follow. For example, the transition from section 2.2 to 2.3 was very disjointed: it was unclear what role the matrix coalescent was playing in the calculation of the expected branch length, which was brought up right above it. I would recommend adding a schematic that describes how the different steps of the algorithm relate to each other, and where the key improvements are, perhaps using an example drawing of a segment with a certain number of descendant and ancestral lineages, embedded in a larger population graph. Another useful schematic could be used to describe the different steps in the data analysis pipeline.
What is the size (in physical distance) of each simulation? What are their mutation and recombination rates? Are these supposed to represent 50 uncorrelated windows from the same genome, which are used to infer the same demographic history? Does this imply that a real-world application would involve partitioning the genome a priori somehow? It was unclear why the author was using 50 simulations, it would be be good to explain the reason for that, especially for readers who are not familiar with the original legofit program.
It would be nice to see a small application to a real-world data problem, to motivate the use of the algorithm, and a comparison of run times between the old and new versions under this scenario, for an end user to have a realistic assessment of the speed improvement. This could involve, for example, inference in a dataset involving a small number of admixture and population split times on a real human genome, like the super-archaic scenario from Prufer et al. (2014), used by the author in Rogers (2019).
Related to the above comments, are the results on the super-archaic scenario in any way affected by the improvements (in terms of greater parameter accuracy) of the new algorithm?
It would be helpful to add parameter names to the schematic in Figure 1: TA, TXYND, NXY, etc. to guide the reader in subsequent figures.
It was unclear why the author was focusing on both the sum and the difference in the 2 migration parameters. Are these sums and differences calculated post-hoc after inference of the individual migration parameters? If so, what is the information provided by the accuracy plots of different linear combinations of them?
Numerical references are out of order (e.g. first reference: 11-13)
https://doi.org/10.24072/pci.mcb.100036.rev12