
Recommendation
Metabolism is the driving force of life and thereby plays a key role in understanding microbial functioning in monoculture and in ecosystems, from natural habitats to biotechnological applications, from microbiomes related to human health to food production. However, the complexity of metabolic networks poses a major challenge for understanding how they are shaped by evolution and how we can manipulate them. Therefore, many network-based methods have been developed to study metabolism.
With the vast increase of genomic data, genome-scale metabolic networks have become popular use. For these stoichiometric models, metabolic enzymes are predicted using genome data and subsequently algorithms are used to add reactions to construct a complete (biomass producing) metabolic network (e.g., Henry et al., 2010; Machado et al., 2018; see for an overview Mendoza et al., 2019). Many tools are being developed to make predictions with these models, usually variations of FBA (Orth et al., 2010), but also methods for community predictions (Scott Jr et al., 2023) and simulations in time and space (Bauer et al., 2017; Dukovski et al., 2021). The vast amount of sequencing data combined with the high-throughput possibilities of this method make it appealing, but there is a drawback: Namely that the automated construction of networks lacks accuracy and often curation is necessary before these models produce realistic and useful results. This is exemplified by recent studies of microbial metabolism that are better predicted by genome content only than by actual metabolic models (Gralka et al., 2023; Li et al., 2023).
On the other end are well-curated small-scale models of metabolic pathways. For those, knowledge of the enzymes of a pathway, their kinetic properties and (optionally) regulation by metabolites is incorporated in usually a differential equation model. Standard methods for systems of differential equations can be used to study steady-states and the dynamics of these models, which can lead to accurate predictions (Flamholz et al., 2013; van Heerden et al., 2014). However, the downside is that the methods are difficult to scale up and, for many enzymes, the detailed information necessary for these models is not available. Combined with computational challenges, these models are limited to specific pathways and cannot be used for whole cells, nor even communities. Therefore, there is still a need for both methods and models to make accurate predictions on a scale beyond single pathways.
Corrao et al. (2025) aim for an intermediate size model that is both accurate and predictive, does not need an extensive set of enzyme parameters, but also encompasses most of the cell’s metabolic pathways. As they phrase it: a model in the ‘Goldilocks’ zone. Curation can improve genome-scale models substantially but requires additional experimental data. However, as the authors show, even the well-curated model of Escherichia coli can sometimes show unrealistic metabolic flux patterns. A smaller model can be better curated and therefore more predictive, and more methods can be applied, as for example EFM based approaches. The authors show an extensive set of methodologies that can be applied to this model and yield interpretable results. Additionally, the model contains a wealth of standardized annotation that could set a standard for the field.
This is a first model of its kind, and it is not surprising that E. coli is used as its metabolism is very well-studied. However, this could set the basis for similar models for other well-studied organisms. Because the model is well-annotated and characterized, it is very suitable for testing new methods that make predictions with such an intermediate-sized model and that can later be extended for larger models. In the future, such models for different species could aid the creation of methods for studying and predicting metabolism in communities, for which there is a large need for applications (e.g. bioremediation and human health).
The different layers of annotation and the available code with clear documentation make this model an ideal resource as teaching material as well. Methods can be explained on this model, which can still be visualized and interpreted because of its reduced size, while it is large enough to show the differences between methods.
Although it might be too much to expect models of this type for all species, the different layers of annotation can be used to inspire better annotation of genome-scale models and enhance their accuracy and predictability. Thus, this paper sets a standard that could benefit research on metabolic pathways from individual strains to natural communities to communities for biotechnology, bioremediation and human health.
References
Bauer, E., Zimmermann, J., Baldini, F., Thiele, I., Kaleta, C., 2017. BacArena: Individual-based metabolic modeling of heterogeneous microbes in complex communities. PLOS Comput. Biol. 13, e1005544. https://doi.org/10.1371/journal.pcbi.1005544
Corrao, M., He, H., Liebermeister, W., Noor, E., Bar-Even, A., 2025. A compact model of Escherichia coli core and biosynthetic metabolism. https://doi.org/10.48550/arXiv.2406.16596
Dukovski, I., Bajić, D., Chacón, J.M., Quintin, M., Vila, J.C.C., Sulheim, S., Pacheco, A.R., Bernstein, D.B., Riehl, W.J., Korolev, K.S., Sanchez, A., Harcombe, W.R., Segrè, D., 2021. A metabolic modeling platform for the computation of microbial ecosystems in time and space (COMETS). Nat. Protoc. 16, 5030–5082. https://doi.org/10.1038/s41596-021-00593-3
Flamholz, A., Noor, E., Bar-Even, A., Liebermeister, W., Milo, R., 2013. Glycolytic strategy as a tradeoff between energy yield and protein cost. Proc. Natl. Acad. Sci. 110, 10039–10044. https://doi.org/10.1073/pnas.1215283110
Gralka, M., Pollak, S., Cordero, O.X., 2023. Genome content predicts the carbon catabolic preferences of heterotrophic bacteria. Nat. Microbiol. 8, 1799–1808. https://doi.org/10.1038/s41564-023-01458-z
Henry, C.S., DeJongh, M., Best, A.A., Frybarger, P.M., Linsay, B., Stevens, R.L., 2010. High-throughput generation, optimization and analysis of genome-scale metabolic models. Nat. Biotechnol. 28, 977–982. https://doi.org/10.1038/nbt.1672
Li, Z., Selim, A., Kuehn, S., 2023. Statistical prediction of microbial metabolic traits from genomes. PLOS Comput. Biol. 19, e1011705. https://doi.org/10.1371/journal.pcbi.1011705
Machado, D., Andrejev, S., Tramontano, M., Patil, K.R., 2018. Fast automated reconstruction of genome-scale metabolic models for microbial species and communities. Nucleic Acids Res. 46, 7542–7553. https://doi.org/10.1093/nar/gky537
Mendoza, S.N., Olivier, B.G., Molenaar, D., Teusink, B., 2019. A systematic assessment of current genome-scale metabolic reconstruction tools. Genome Biol. 20, 158. https://doi.org/10.1186/s13059-019-1769-1
Orth, J.D., Thiele, I., Palsson, B.Ø., 2010. What is flux balance analysis? Nat. Biotechnol. 28, 245–248. https://doi.org/10.1038/nbt.1614
Scott Jr, W.T., Benito-Vaquerizo, S., Zimmermann, J., Bajić, D., Heinken, A., Suarez-Diez, M., Schaap, P.J., 2023. A structured evaluation of genome-scale constraint-based modeling tools for microbial consortia. PLOS Comput. Biol. 19, e1011363. https://doi.org/10.1371/journal.pcbi.1011363
van Heerden, J.H., Wortel, M.T., Bruggeman, F.J., Heijnen, J.J., Bollen, Y.J.M., Planqué, R., Hulshof, J., O’Toole, T.G., Wahl, S.A., Teusink, B., 2014. Lost in Transition: Start-Up of Glycolysis Yields Subpopulations of Nongrowing Cells. Science 343, 1245114. https://doi.org/10.1126/science.1245114
DOI or URL of the preprint: https://doi.org/10.48550/arXiv.2406.16596
Version of the preprint: 3
 , posted 07 Apr 2025, validated 07 Apr 2025
Thank you for your resubmission. You have responded satisfactory to all points raised by the reviewers and I can recommend your article. However, I did see a few points that could improve the readability of your article. I invite you to have a look at these suggestions and decide to incorporate them for a final version:
DOI or URL of the preprint: https://doi.org/10.48550/arXiv.2406.16596
Version of the preprint: 2
, posted 19 Dec 2024, validated 20 Dec 2024All three reviews positively evaluate your manuscript and agree that the model is a valueable resource for the community. However, they raise minor issues that could improve your manuscript. A point raised by two reviewers is the validation of the parameter fitting. Moreover, several smaller points address the clarity of the text and minor suggestions. Based on the reviews this preprint does not need extensive revision, but one reviewer suggests additional comparisons with previous models that could be considered. As a last point, one reviewer checked all the provided code and commends the clarity of the code, but reports some minor issues that would increase the usability if resolved.
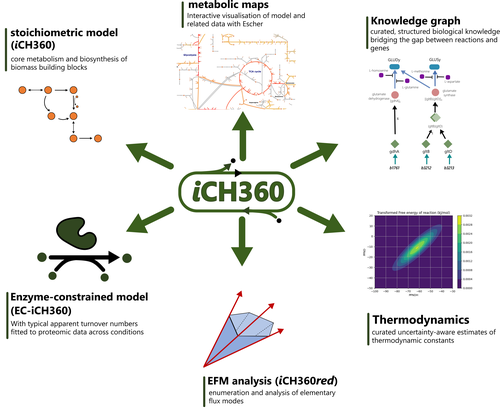
, 13 Dec 2024The authors developed a central metabolic model of Escherichia coli, named iCH360, which expands on core carbon metabolism by including pathways for amino acid, fatty acid, and nucleotide biosynthesis. They demonstrated its utility through applications involving standard flux balance analysis (FBA) as well as integrated approaches with thermodynamic and kinetic calculations. With detailed annotations of enzymes and transporters, iCH360 serves as an excellent platform that integrates comprehensive biochemical knowledge about central metabolism. The model is exceptionally valuable from an educational perspective. One can envision using the reconstruction and applications described in this paper to develop a semester-long systems biology course, transitioning from simpler to more complex modeling approaches. From a research perspective, iCH360 is an ideal model for the initial testing of novel algorithms, such as those integrating gene expression or metabolite concentrations into metabolic networks. I anticipate that iCH360, along with its derivatives also provided by the authors, will become a standard tool in the metabolic network modeling community.
The manuscript is generally well-written, though some parts are overly complex. Below are some suggestions and questions to improve clarity:
1) In sections like 2.2, it would be beneficial to include comparisons with the ECC and ECC2 models alongside the parent model iML1515 to provide a clearer context for iCH360’s advancements and distinctions.
2) Page 2: "For example, when designing and testing gene knockout strategies, genome-scale networks often wrongly predict unphysiological metabolic bypasses which have to be manually inspected and filtered out". This statement needs a supporting reference.
3) Figure 1: It is not clear what type of conversions are represented by the four reactions right above the grey area (the rectangular region with Phosphate-CO2-Ammonium-related pathways) on the lower left corner.
4) Page 3: "The final assembled model (Figure 1) comprises 304 compartment-specific metabolites and 323 metabolic reactions mapped to 360 genes, thus qualifying as a medium-scale model ranging in between ECC and iML1515 (Supplementary Figure 5)." Please also indicate the number of unique metabolites excluding compartmentalization.
5) Page 7: "By simultaneously fitting all available conditions, we ensured that our adjustment procedure is robust to condition-specific biases. Further, by introducing regularisation within our adjustment scheme, we penalised large deviations of parameters from the original dataset, increasing the robustness of the procedure to overfitting"
Based on these statements, can the authors do a "leave-one-condition-out" cross validation test to confirm the robustness of their procedure? I must add that I cannot see how this can be done based on the descriptions in Supplementary Information. If this indeed cannot be done, then the abovementioned statements may need to be revisited and clarified. For example, what is the advantage of simultaneous fitting if each condition is fitted with a separate parameter?
6) Page 8: The following sentence is not clear: "However, it is worth noting that this analysis was performed using a simple capacity-based enzyme cost function, which summarises different determinants of enzyme cost such as driving force and substrate saturation [27] in one single value, assumed to be constant. " Please rephrase.
7) Page 9: "As substrate availability is increased, the cost of substrate uptake decreases and higher growth rates are achieved by switching to lower yield, acetatesecreting modes, in line with typical observations of overflow metabolism in E. coli [29, 30]. However, the satFBA formalism can also be used with additional flux bounds, thus going beyond EFM-based analysis. For example, if a positive lower bound on ATP hydrolysis is added as a maintenance requirement, optimal solutions to the satFBA problem will no longer be elementary modes, and the yield of the optimal solution no longer follows a piecewise constant profile (Supplementary Figure 16)"
This section is not clear. Specifically, the differences highlighted between Fig. 6 and Supp. Fig. 16, as mentioned in the text, are not readily apparent. Could the authors clarify this section and ensure the figures distinctly represent what is described?
8) Figure 6C: "C: The yield of the optimal satFBA solution, computed as the ratio of biomass flux to glucose uptake, progressively decreases as external glucose availability increases."
Is the definition of yield the same everywhere in the manuscript? If so, this definition could be provided earlier to avoid confusion.
9) Supp.Tbl. 2: One type of edge between a reaction and a protein indicates inactive proteins. How many of the 360 genes in the model encode inactive proteins?
10) Supp.Tbl. 2: The AND/OR example of the last row is not clear. How is this related to AND or OR connections?
11)Supp.Inf. A.3: Eqn 18 and the bullet point that explains it are not clear. It would be useful to provide an example or examples from complicated GPRs with mixed ANDs and ORs.
12)Page 15, Eqn. 5: Not clear where Eqn. 5 comes from. Also, mu is the specific growth rate, which, by definition, is the flux of biomass reaction (vBM). So it is not clear why we need the other terms and what is being achieved in this section (4.10).
13)Page 16: "where b is the min driving force (or the MDF after optimisation), c ∈ Rm is a vector of log-metabolite concentrations, lc; uc ∈ Rm are (log) lower and upper bounds on these concentrations, S ∈ Rm×N is the stoichiometric matrix of the model, R is the Boltzmann gas constant, and T is the temperature used for the computation of the free energy estimates. "
I believe what is said to be the Boltzmann gas constant here (traditionally this is denoted by a "k" not "R") is actually the ideal gas constant.
14) Section A.5.3: "Following the sMOMENT formulation of enzyme-constrained FBA [23], we consider a metabolic network with N reactions and M metabolites where all metabolic fluxes are positive (i.e. reversible reactions are split into forward and backwards components) and at most one enzyme is associated with each reaction."
Based on the last part of this sentence, it is not clear what is done when multiple enzymes (isozymes) are involved in a reaction.
15) Section A.5.3, Eqn. 29: Biomass production reactions are typically irreversible. So, it is not clear what the negative biomass flux is needed to account for.
16) Finally, could the authors please explain how much of the knowledge graph annotations are included in the JSON or SBML versions of the iCH360 model?
, 12 Dec 2024