
Latest recommendations
| Id | Title * | Authors * | Abstract * | Picture * | Thematic fields * | Recommender | Reviewers | Submission date | |
|---|---|---|---|---|---|---|---|---|---|
22 Jul 2024
Genetic Evidence for Geographic Structure within the Neanderthal PopulationDecline in Neanderthal effective population size due to geographic structure and gene flowRecommended by Raquel Assis based on reviews by David Bryant and Guillaume AchazPublished PSMC estimates of Neanderthal effective population size (𝑁e) show an approximately five-fold decline over the past 20,000 years [1]. This observation may be attributed to a true decline in Neanderthal 𝑁e, statistical error that is notorious with PSMC estimation, or geographic subdivision and gene flow that has been hypothesized to occur within the Neanderthal population. Determining which of these factors contributes to the observed decline in Neanderthal 𝑁e is an important question that can provide insight into human evolutionary history. Though it is widely believed that the decline in Neanderthal 𝑁e is due to geographic subdivision and gene flow, no prior studies have theoretically examined whether these evolutionary processes can yield the observed pattern. In this paper [2], Rogers tackles this problem by employing two mathematical models to explore the roles of geographic subdivision and gene flow in the Neanderthal population. Results from both models show that geographic subdivision and gene flow can indeed result in a decline in 𝑁e that mirrors the observed decline estimated from empirical data. In contrast, Rogers argues that neither statistical error in PSMC estimates nor a true decline in 𝑁e are expected to produce the consistent decline in estimated 𝑁e observed across three distinct Neanderthal fossils. Statistical error would likely result in variation among these curves, whereas a true decline in 𝑁e would produce shifted curves due to the different ages of the three Neanderthal fossils. In summary, Rogers provides convincing evidence that the most reasonable explanation for the observed decline in Neanderthal 𝑁e is geographic subdivision and gene flow. Rogers also provides a basis for understanding this observation, suggesting that 𝑁e declines over time because coalescence times are shorter between more recent ancestors, as they are more likely to be geographic neighbors. Hence, Rogers’ theoretical findings shed light on an interesting aspect of human evolutionary history. References [1] Fabrizio Mafessoni, Steffi Grote, Cesare de Filippo, Svante Pääbo (2020) “A high-coverage Neandertal genome from Chagyrskaya Cave”. Proceedings of the National Academy of Sciences USA 117: 15132- 15136. https://doi.org/10.1073/pnas.2004944117 [2] Alan Rogers (2024) “Genetic evidence for geographic structure within the Neanderthal population”. bioRxiv, version 4 peer-reviewed and recommended by Peer Community in Mathematical and Computational Biology. https://doi.org/10.1101/2023.07.28.551046 | Genetic Evidence for Geographic Structure within the Neanderthal Population | Alan R. Rogers | <p>PSMC estimates of Neanderthal effective population size (N<sub>e</sub>)exhibit a roughly 5-fold decline across the most recent 20 ky before the death of each fossil. To explain this pattern, this article develops new theory relating... | | Evolutionary Biology, Genetics and population Genetics | Raquel Assis | 2023-10-17 18:06:38 | ||
28 Jun 2024
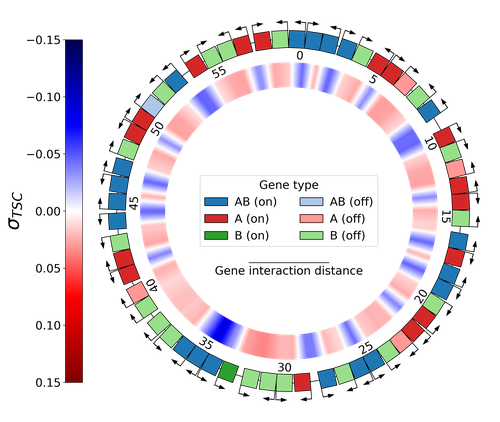
Emergence of Supercoiling-Mediated Regulatory Networks through the Evolution of Bacterial Chromosome OrganizationUnderstanding the impact of the transcription-supercoiling coupling on bacterial genome evolutionRecommended by Nelle Varoquaux based on reviews by Ivan Junier and 1 anonymous reviewer based on reviews by Ivan Junier and 1 anonymous reviewer
DNA supercoiling, the under or overwinding of DNA, is known to strongly impact gene expression, as changes in levels of supercoiling directly influence transcription rates. In turn, gene transcription generates DNA supercoiling on each side of an advancing RNA polymerase. This coupling between DNA supercoiling and transcription may result in different outcomes, depending on neighboring gene orientations: divergent genes tend to increase transcription levels, convergent genes tend to inhibit each other, while tandem genes may exhibit more intricate relationships. While several works have investigated the relationship between transcription and supercoiling, Grohens et al [1] address a different question: how does transcription-supercoiling coupling drive genome evolution? To this end, they consider a simple model of gene expression regulation where transcription level only depends on the local DNA supercoiling and where the transcription of one gene generates a linear profile of positive and negative DNA supercoiling on each side of it. They then make genomes evolve through genomic inversions only considering a fitness that reflects the ability of a genome to cope with two distinct environments for which different genes have to be activated or repressed. Using this simple model, the authors illustrate how evolutionary adaptation via genomic inversions can adjust expression levels for enhanced fitness within specific environments, particularly with the emergence of relaxation-activated genes. Investigating the genomic organization of individual genomes revealed that genes are locally organized to leverage the transcription-supercoiling coupling for activation or inhibition, but larger-scale networks of genes are required to strongly inhibit genes (sometimes up to networks of 20 genes). Thus, supercoiling-mediated interactions between genes can implicate more than just local genes. Finally, they construct an "effective interaction graph" between genes by successively simulating gene knock-outs for all of the genes of an individual and observing the effect on the expression level of other genes. They observe a densely connected interaction network, implying that supercoiling-based regulation could evolve concurrently with genome organization in bacterial genomes. References [1] Théotime Grohens, Sam Meyer, Guillaume Beslon (2024) Emergence of Supercoiling-Mediated Regulatory Networks through the Evolution of Bacterial Chromosome Organization. bioRxiv, ver. 4 peer-reviewed and recommended by Peer Community in Mathematical and Computational Biology https://doi.org/10.1101/2022.09.23.509185 | Emergence of Supercoiling-Mediated Regulatory Networks through the Evolution of Bacterial Chromosome Organization | Théotime Grohens, Sam Meyer, Guillaume Beslon | <p>DNA supercoiling -- the level of twisting and writhing of the DNA molecule around itself -- plays a major role in the regulation of gene expression in bacteria by modulating promoter activity. The level of DNA supercoiling is a dynamic property... | | Biophysics, Evolutionary Biology, Systems biology | Nelle Varoquaux | 2023-06-30 10:34:28 | ||
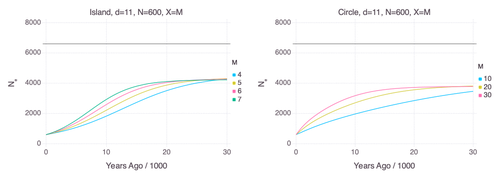
10 Apr 2024
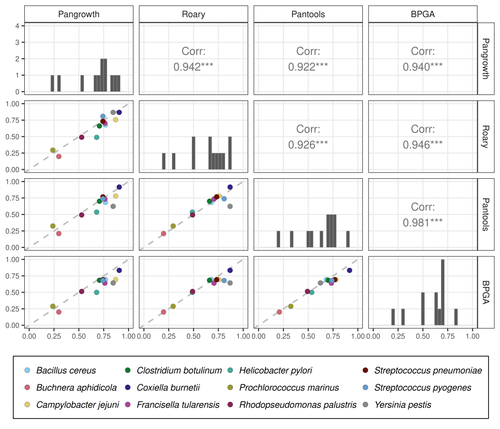
Revisiting pangenome openness with k-mersFaster method for estimating the openness of speciesRecommended by Leo van Iersel based on reviews by Guillaume Marçais, Abiola Akinnubi and 1 anonymous reviewerWhen sequencing more and more genomes of a species (or a group of closely related species), a natural question to ask is how quickly the total number of distinct sequences grows as a function of the total number of sequenced genomes. A similar question can be asked about the number of distinct genes or the number of distinct k-mers (length-k subsequences). References [1] Parmigiani L., Wittler, R. and Stoye, J. (2024) "Revisiting pangenome openness with k-mers". bioRxiv, ver. 4 peer-reviewed and recommended by Peer Community In Mathematical and Computational Biology. https://doi.org/10.1101/2022.11.15.516472 | Revisiting pangenome openness with k-mers | Luca Parmigiani, Roland Wittler, Jens Stoye | <p style="text-align: justify;">Pangenomics is the study of related genomes collectively, usually from the same species or closely related taxa. Originally, pangenomes were defined for bacterial species. After the concept was extended to eukaryoti... | | Combinatorics, Genomics and Transcriptomics | Leo van Iersel | Guillaume Marçais, Yadong Zhang | 2022-11-22 14:48:18 | |
26 Feb 2024

A workflow for processing global datasets: application to intercroppingCollecting, assembling and sharing data in crop sciencesRecommended by Eric Tannier based on reviews by Christine Dillmann and 2 anonymous reviewers
It is often the case that scientific knowledge exists but is scattered across numerous experimental studies. Because of this dispersion in different formats, it remains difficult to access, extract, reproduce, confirm or generalise. This is the case in crop science, where Mahmoud et al [1] propose to collect and assemble data from numerous field experiments on intercropping. It happens that the construction of the global dataset requires a lot of time, attention and a well thought-out method, inspired by the literature on data science [2] and adapted to the specificities of crop science. This activity also leads to new possibilities that were not available in individual datasets, such as the detection of full factorial designs using graph theory tools developed on top of the global dataset. The study by Mahmoud et al [1] has thus multiple dimensions:
I was particularly interested in the promotion of the FAIR principles, perhaps used a little too uncritically in my view, as an obvious solution to data sharing. On the one hand, I am admiring and grateful for the availability of these data, some of which have never been published, nor associated with published results. This approach is likely to unearth buried treasures. On the other hand, I can understand the reluctance of some data producers to commit to total, definitive sharing, facilitating automatic reading, without having thought about a certain reciprocity on the part of users and use by artificial intelligence. Reciprocity in terms of recognition, as is discussed by Mahmoud et al [1], but also in terms of contribution to the commons [5] or reading conditions for machine learning. References [1] Mahmoud R., Casadebaig P., Hilgert N., Gaudio N. A workflow for processing global datasets: application to intercropping. 2024. ⟨hal-04145269v2⟩ ver. 2 peer-reviewed and recommended by Peer Community in Mathematical and Computational Biology. https://hal.science/hal-04145269 [2] Wickham, H. 2014. Tidy data. Journal of Statistical Software 59(10) https://doi.org/10.18637/jss.v059.i10 [3] Gaudio, N., R. Mahmoud, L. Bedoussac, E. Justes, E.-P. Journet, et al. 2023. A global dataset gathering 37 field experiments involving cereal-legume intercrops and their corresponding sole crops. https://doi.org/10.5281/zenodo.8081577 [4] Mahmoud, R., Casadebaig, P., Hilgert, N. et al. Species choice and N fertilization influence yield gains through complementarity and selection effects in cereal-legume intercrops. Agron. Sustain. Dev. 42, 12 (2022). https://doi.org/10.1007/s13593-022-00754-y [5] Bernault, C. « Licences réciproques » et droit d'auteur : l'économie collaborative au service des biens communs ?. Mélanges en l'honneur de François Collart Dutilleul, Dalloz, pp.91-102, 2017, 978-2-247-17057-9. https://shs.hal.science/halshs-01562241 | A workflow for processing global datasets: application to intercropping | Rémi Mahmoud, Pierre Casadebaig, Nadine Hilgert, Noémie Gaudio | <p>Field experiments are a key source of data and knowledge in agricultural research. An emerging practice is to compile the measurements and results of these experiments (rather than the results of publications, as in meta-analysis) into global d... | | Agricultural Science | Eric Tannier | 2023-06-29 15:38:28 | ||
10 Jan 2024
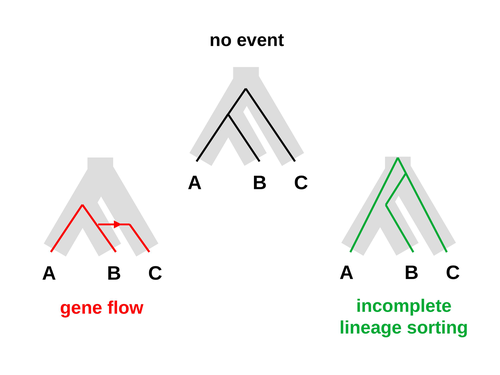
An approximate likelihood method reveals ancient gene flow between human, chimpanzee and gorillaAphid: A Novel Statistical Method for Dissecting Gene Flow and Lineage Sorting in Phylogenetic ConflictRecommended by Alan Rogers based on reviews by Richard Durbin and 2 anonymous reviewers
Galtier [1] introduces “Aphid,” a new statistical method that estimates the contributions of gene flow (GF) and incomplete lineage sorting (ILS) to phylogenetic conflict. Aphid is based on the observation that GF tends to make gene genealogies shorter, whereas ILS makes them longer. Rather than fitting the full likelihood, it models the distribution of gene genealogies as a mixture of several canonical gene genealogies in which coalescence times are set equal to their expectations under different models. This simplification makes Aphid far faster than competing methods. In addition, it deals gracefully with bidirectional gene flow—an impossibility under competing models. Because of these advantages, Aphid represents an important addition to the toolkit of evolutionary genetics. In the interest of speed, Aphid makes several simplifying assumptions. Yet even when these were violated, Aphid did well at estimating parameters from simulated data. It seems to be reasonably robust. Aphid studies phylogenetic conflict, which occurs when some loci imply one phylogenetic tree and other loci imply another. This happens when the interval between successive speciation events is fairly short. If this interval is too short, however, Aphid’s approximations break down, and its estimates are biased. Galtier suggests caution when the fraction of discordant phylogenetic trees exceeds 50–55%. Thus, Aphids will be most useful when the interval between speciation events is short, but not too short. Galtier applies the new method to three sets of primate data. In two of these data sets (baboons and African apes), Aphid detects gene flow that would likely be missed by competing methods. These competing methods are primarily sensitive to gene flow that is asymmetric in two senses: (1) greater flow in one direction than the other, and (2) unequal gene flow connecting an outgroup to two sister species. Aphid finds evidence of symmetric gene flow in the ancestry of baboons and also in that of African apes. The data suggest that ancestral humans and chimpanzees both interbred with ancestral gorillas, and at about the same rate. Aphid’s ability to detect this signature sets it apart from competing methods. References [1] Nicolas Galtier (2023) “An approximate likelihood method reveals ancient gene flow between human, chimpanzee and gorilla”. bioRxiv, ver. 3 peer-reviewed and recommended by Peer Community in Mathematical and Computational Biology. https://doi.org/10.1101/2023.07.06.547897 | An approximate likelihood method reveals ancient gene flow between human, chimpanzee and gorilla | Nicolas Galtier | <p>Gene flow and incomplete lineage sorting are two distinct sources of phylogenetic conflict, i.e., gene trees that differ in topology from each other and from the species tree. Distinguishing between the two processes is a key objective of curre... | | Evolutionary Biology, Genetics and population Genetics, Genomics and Transcriptomics | Alan Rogers | 2023-07-06 18:41:16 | ||
09 Nov 2023
A mechanistic-statistical approach to infer dispersal and demography from invasion dynamics, applied to a plant pathogenA mechanistic-statistical approach for the field-based study of invasion dynamicsRecommended by Hirohisa Kishino based on reviews by 2 anonymous reviewers
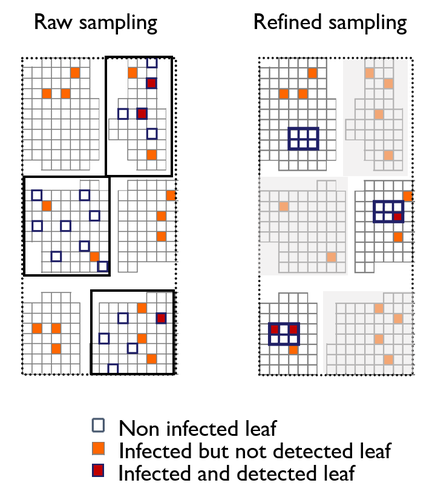
To study the annual invasion of a tree pathogen (Melampsora larici-populina, a fungal species responsible for the poplar rust disease), Xhaard et al (2012) had conducted a spatiotemporal survey along the Durance River valley in the French Alps over nearly 200 km, measuring sampled leaves and twigs from 40 to 150 trees at 12 evenly spaced study sites at seven-time points. By combining Bayesian genetic assignment and a landscape epidemiology approach, they were able to estimate the genetic origin and annual spread of the plant pathogen during a single epidemic. The observed temporal variation in the spatial pattern of infection rates allowed Saubin et al (2023) to estimate the key factors that determine the speed of the invasion dynamics. In particular, it is crucial to estimate the probability and extent of long-distance dispersal. The dynamics of the macroscale population density was formulated by the reaction-diffusion (R.D.) model and by the integro-difference (I.D.) model. Both consist of the diffusion/dispersal component and the reaction component. In the I.D. model, the kernel function represents the distribution of the dispersion. The likelihood function was obtained by coupling the mathematical model of the population dynamics and the statistical model of the observational process. Saubin et al (2023) considered a thin-tailed Gaussian kernel, a heavy-tailed exponential kernel, and a fat-tailed exponential power kernel. The numerical simulation reflecting the above survey confirmed the identifiability of the propagation kernel and the accuracy of the parameter estimation. In particular, the above survey had the high power to identify the model with frequent long-distance dispersal. The data from the survey selected the exponential power kernel with confidence. The mean dispersal distance was estimated to be 2.01 km. The exponential power was 0.24. This parameter value predicts that 5% of the dispersals will have a distance > 14.3 km and 1% will have a distance > 36.0 km. The mechanistic-statistical approach presented here may become a new standard for the field-based studies of invasion dynamics. References Saubin, M., Coville, J., Xhaard, C., Frey, P., Soubeyrand, S., Halkett, F., and Fabre, F. (2023). A mechanistic-statistical approach to infer dispersal and demography from invasion dynamics, applied to a plant pathogen. bioRxiv, ver. 5 peer-reviewed and recommended by Peer Community in Mathematical and Computational Biology. https://doi.org/10.1101/2023.03.21.533642 Xhaard, C., Barrès, B., Andrieux, A., Bousset, L., Halkett, F., and Frey, P. (2012). Disentangling the genetic origins of a plant pathogen during disease spread using an original molecular epidemiology approach. Molecular Ecology, 21(10):2383-2398. https://doi.org/10.1111/j.1365-294X.2012.05556.x | A mechanistic-statistical approach to infer dispersal and demography from invasion dynamics, applied to a plant pathogen | Méline Saubin, Jérome Coville, Constance Xhaard, Pascal Frey, Samuel Soubeyrand, Fabien Halkett, Frédéric Fabre | <p style="text-align: justify;">Dispersal, and in particular the frequency of long-distance dispersal (LDD) events, has strong implications for population dynamics with possibly the acceleration of the colonisation front, and for evolution with po... | | Dynamical systems, Ecology, Epidemiology, Probability and statistics | Hirohisa Kishino | 2023-05-10 09:57:25 | ||
12 Oct 2023
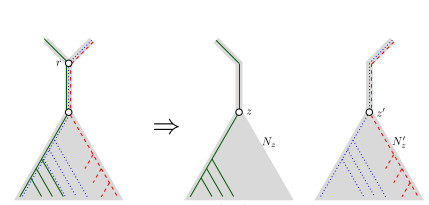
When Three Trees Go to WarBounding the reticulation number for three phylogenetic treesRecommended by Simone Linz based on reviews by Guillaume Scholz and Stefan GrünewaldReconstructing a phylogenetic network for a set of conflicting phylogenetic trees on the same set of leaves remains an active strand of research in mathematical and computational phylogenetic since 2005, when Baroni et al. [1] showed that the minimum number of reticulations h(T,T') needed to simultaneously embed two rooted binary phylogenetic trees T and T' into a rooted binary phylogenetic network is one less than the size of a maximum acyclic agreement forest for T and T'. In the same paper, the authors showed that h(T,T') is bounded from above by n-2, where n is the number of leaves of T and T' and that this bound is sharp. That is, for a fixed n, there exist two rooted binary phylogenetic trees T and T' such that h(T,T')=n-2. Since 2005, many papers have been published that develop exact algorithms and heuristics to solve the above NP-hard minimisation problem in practice, which is often referred to as Minimum Hybridisation in the literature, and that further investigate the mathematical underpinnings of Minimum Hybridisation and related problems. However, many such studies are restricted to two trees and much less is known about Minimum Hybridisation for when the input consists of more than two phylogenetic trees, which is the more relevant cases from a biological point of view. In [2], van Iersel, Jones, and Weller establish the first lower bound for the minimum reticulation number for more than two rooted binary phylogenetic trees, with a focus on exactly three trees. The above-mentioned connection between the minimum number of reticulations and maximum acyclic agreement forests does not extend to three (or more) trees. Instead, to establish their result, the authors use multi-labelled trees as an intermediate structure between phylogenetic trees and phylogenetic networks to show that, for each ε>0, there exist three caterpillar trees on n leaves such that any phylogenetic network that simultaneously embeds these three trees has at least (3/2 - ε)n reticulations. Perhaps unsurprising, caterpillar trees were also used by Baroni et al. [1] to establish that their upper bound on h(T,T') is sharp. Structurally, these trees have the property that each internal vertex is adjacent to a leaf. Each caterpillar tree can therefore be viewed as a sequence of characters, and it is exactly this viewpoint that is heavily used in [2]. More specifically, sequences with short common subsequences correspond to caterpillar trees that need many reticulations when embedded in a phylogenetic network. It would consequently be interesting to further investigate connections between caterpillar trees and certain types of sequences. Can they be used to shed more light on bounds for the minimum reticulation number? References [1] Baroni, M., Grünewald, S., Moulton, V., and Semple, C. (2005) "Bounding the number of hybridisation events for a consistent evolutionary history". J. Math. Biol. 51, 171–182. https://doi.org/10.1007/s00285-005-0315-9 | When Three Trees Go to War | Leo van Iersel and Mark Jones and Mathias Weller | <p style="text-align: justify;">How many reticulations are needed for a phylogenetic network to display a given set of k phylogenetic trees on n leaves? For k = 2, Baroni, Semple, and Steel [Ann. Comb. 8, 391-408 (2005)] showed that the answer is ... | | Combinatorics, Evolutionary Biology, Graph theory | Simone Linz | 2023-03-07 18:49:21 | ||
18 Sep 2023
General encoding of canonical k-mersMinimal encodings of canonical k-mers for general alphabets and even k-mer sizesRecommended by Paul Medvedev based on reviews by 2 anonymous reviewersAs part of many bioinformatics tools, one encodes a k-mer, which is a string, into an integer. The natural encoding uses a bijective function to map the k-mers onto the interval [0, s^k - ], where s is the alphabet size. This encoding is minimal, in the sense that the encoded integer ranges from 0 to the number of represented k-mers minus 1. However, often one is only interested in encoding canonical k-mers. One common definition is that a k-mer is canonical if it is lexicographically not larger than its reverse complement. In this case, only about half the k-mers from the universe of k-mers are canonical, and the natural encoding is no longer minimal. For the special case of a DNA alphabet and odd k, there exists a "parity-based" encoding for canonical k-mers which is minimal. In [1], the author presents a minimal encoding for canonical k-mers that works for general alphabets and both odd and even k. They also give an efficient bit-based representation for the DNA alphabet. This paper fills a theoretically interesting and often overlooked gap in how to encode k-mers as integers. It is not yet clear what practical applications this encoding will have, as the author readily acknowledges in the manuscript. Neither the author nor the reviewers are aware of any practical situations where the lack of a minimal encoding "leads to serious limitations." However, even in an applied field like bioinformatics, it would be short-sighted to only value theoretical work that has an immediate application; often, the application is several hops away and not apparent at the time of the original work. In fact, I would speculate that there may be significant benefits reaped if there was more theoretical attention paid to the fact that k-mers are often restricted to be canonical. Many papers in the field sweep under the rug the fact that k-mers are made canonical, leaving it as an implementation detail. This may indicate that the theory to describe and analyze this situation is underdeveloped. This paper makes a step forward to develop this theory, and I am hopeful that it may lead to substantial practical impact in the future. References [1] Roland Wittler (2023) "General encoding of canonical k-mers. bioRxiv, ver.2, peer-reviewed and recommended by Peer Community in Mathematical and Computational Biology https://doi.org/10.1101/2023.03.09.531845 | General encoding of canonical *k*-mers | Roland Wittler | <p style="text-align: justify;">To index or compare sequences efficiently, often <em>k</em>-mers, i.e., substrings of fixed length <em>k</em>, are used. For efficient indexing or storage, <em>k</em>-mers are encoded as integers, e.g., applying som... | | Combinatorics, Computational complexity, Genomics and Transcriptomics | Paul Medvedev | Anonymous | 2023-03-13 17:01:37 | |
02 May 2023
Population genetics: coalescence rate and demographic parameters inferenceEstimates of Effective Population Size in Subdivided PopulationsRecommended by Alan Rogers based on reviews by 2 anonymous reviewers
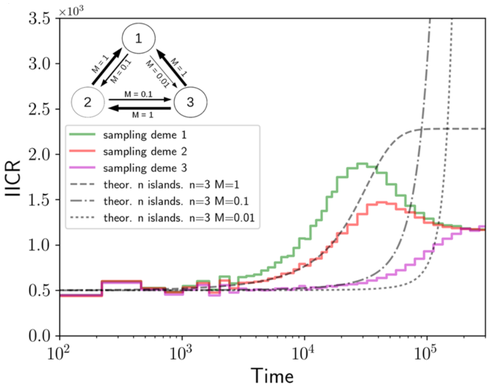
We often use genetic data from a single site, or even a single individual, to estimate the history of effective population size, Ne, over time scales in excess of a million years. Mazet and Noûs [2] emphasize that such estimates may not mean what they seem to mean. The ups and downs of Ne may reflect changes in gene flow or selection, rather than changes in census population size. In fact, gene flow may cause Ne to decline even if the rate of gene flow has remained constant. Consider for example the estimates of archaic population size in Fig. 1, which show an apparent decline in population size between roughly 700 kya and 300 kya. It is tempting to interpret this as evidence of a declining number of individuals, but that is not the only plausible interpretation. Each of these estimates is based on the genome of a single diploid individual. As we trace the ancestry of that individual backwards into the past, the ancestors are likely to remain in the same locale for at least a generation or two. Being neighbors, there’s a chance they will mate. This implies that in the recent past, the ancestors of a sampled individual lived in a population of small effective size. As we continue backwards into the past, there is more and more time for the ancestors to move around on the landscape. The farther back we go, the less likely they are to be neighbors, and the less likely they are to mate. In this more remote past, the ancestors of our sample lived in a population of larger effective size, even if neither the number of individuals nor the rate of gene flow has changed. For awhile then, Ne should increase as we move backwards into the past. This process does not continue forever, because eventually the ancestors will be randomly distributed across the population as a whole. We therefore expect Ne to increase towards an asymptote, which represents the effective size of the entire population. This simple story gets more complex if there is change in either the census size or the rate of gene flow. Mazet and Noûs [2] have shown that one can mimic real estimates of population history using models in which the rate of gene flow varies, but census size does not. This implies that the curves in Fig. 1 are ambiguous. The observed changes in Ne could reflect changes in census size, gene flow, or both. For this reason, Mazet and Noûs [2] would like to replace the term “effective population size” with an alternative, the “inverse instantaneous coalescent rate,” or IIRC. I don’t share this preference, because the same critique could be made of all definitions of Ne. For example, Wright [3, p. 108] showed in 1931 that Ne varies in response to the sex ratio, and this implies that changes in Ne need not involve any change in census size. This is also true when populations are geographically structured, as Mazet and Noûs [2] have emphasized, but this does not seem to require a new vocabulary.
Figure 1: PSMC estimates of the history of population size based on three archaic genomes: two Neanderthals and a Denisovan [1]. Mazet and Noûs [2] also show that estimates of Ne can vary in response to selection. It is not hard to see why such an effect might exist. In genomic regions affected by directional or purifying selection, heterozygosity is low, and common ancestors tend to be recent. Such regions may contribute to small estimates of recent Ne. In regions under balancing selection, heterozygosity is high, and common ancestors tend to be ancient. Such regions may contribute to large estimates of ancient Ne. The magnitude of this effect presumably depends on the fraction of the genome under selection and the rate of recombination. In summary, this article describes several processes that can affect estimates of the history of effective population size. This makes existing estimates ambiguous. For example, should we interpret Fig. 1 as evidence of a declining number of archaic individuals, or in terms of gene flow among archaic subpopulations? But these questions also present research opportunities. If the observed decline reflects gene flow, what does this imply about the geographic structure of archaic populations? Can we resolve the ambiguity by integrating samples from different locales, or using archaeological estimates of population density or interregional trade? REFERENCES [1] Fabrizio Mafessoni et al. “A high-coverage Neandertal genome from Chagyrskaya Cave”. Proceedings of the National Academy of Sciences, USA 117.26 (2020), pp. 15132–15136. https://doi.org/10.1073/pnas.2004944117 [2] Olivier Mazet and Camille Noûs. “Population genetics: coalescence rate and demographic parameters inference”. arXiv, ver. 2 peer-reviewed and recommended by Peer Community In Mathematical and Computational Biology (2023). https://doi.org/10.48550/ARXIV.2207.02111. [3] Sewall Wright. “Evolution in mendelian populations”. Genetics 16 (1931), pp. 97–159. https://doi.org/10.48550/ARXIV.2207.0211110.1093/genetics/16.2.97. | Population genetics: coalescence rate and demographic parameters inference | Olivier Mazet, Camille Noûs | <p style="text-align: justify;">We propose in this article a brief description of the work, over almost a decade, resulting from a collaboration between mathematicians and biologists from four different research laboratories, identifiable as the c... | | Genetics and population Genetics, Probability and statistics | Alan Rogers | Joseph Lachance, Anonymous | 2022-07-11 14:03:04 | |
18 Apr 2023
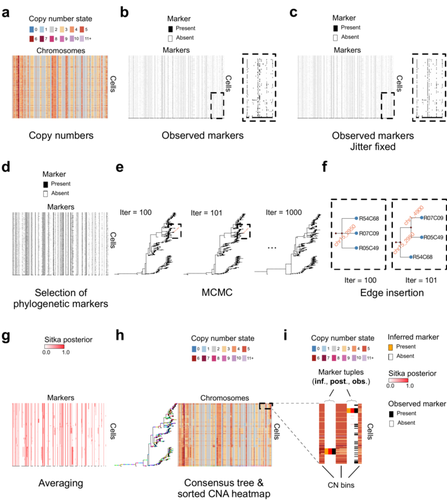
Cancer phylogenetic tree inference at scale from 1000s of single cell genomesPhylogenetic reconstruction from copy number aberration in large scale, low-depth genome-wide single-cell data.Recommended by Amaury Lambert based on reviews by 3 anonymous reviewersThe paper [1] presents and applies a new Bayesian inference method of phylogenetic reconstruction for multiple sequence alignments in the case of low sequencing coverage but diverse copy number aberrations (CNA), with applications to single cell sequencing of tumors. The idea is to take advantage of CNA to reconstruct the topology of the phylogenetic tree of sequenced cells in a first step (the `sitka' method), and in a second step to assign single nucleotide variants (SNV) to tree edges (and then calibrate their lengths) (the `sitka-snv' method). The data are summarized into a binary-valued CxL matrix Y, where C is the number of cells and L is the number of loci (here, loci are segments of prescribed length called `bins'). The entry of Y at row i and column j is 1 (otherwise 0) iff in the ancestral lineage of cell i, at least one genomic rearrangement has occurred, and more specifically the gain or loss of a segment with at least one endpoint in locus j or in locus j+1. The authors expect the infinite-allele assumption to approximately hold (i.e., that at most one mutation occurs at any given marker and that 0 is the ancestral state). They refer to this assumption as the `perfect phylogeny assumption'. By only recording from CNA events the endpoints at which they occur, the authors lose the information on copy number, but they gain the assumption of independence of the mutational processes occurring at different sites, which approximately holds for CNA endpoints. The goal of sitka is to produce a posterior distribution on phylogenetic trees conditional on the matrix Y , where here a phylogenetic tree is understood as containing the information on 1) the topology of the tree but not its edge lengths, and 2) for each edge, the identity of markers having undergone a mutation, in the sense of the previous paragraph. The results of the method are tested against synthetic datasets simulated under various assumptions, including conditions violating the perfect phylogeny assumption and compared to results obtained under other baseline methods. The method is extended to assign SNV to edges of the tree inferred by sitka. It is also applied to real datasets of single cell genomes of tumors. The manuscript is very well-written, with a high degree of detail. The method is novel, scalable, fast and appears to perform favorably compared to other approaches. It has been applied in independent publications, for example to multi-year time-series single-cell whole-genome sequencing of tumors, in order to infer the fitness landscape and its dynamics through time, see [2]. The reviewing process has taken too long, mainly because of other commitments I had during the period and to the difficulty of finding reviewers. Let me apologize to the authors and thank them for their patience as well as for the scientific rigor they brought to their revisions and answers to reviewers, who I also warmly thank for their quality work. REFERENCES [1] Sohrab Salehi, Fatemeh Dorri, Kevin Chern, Farhia Kabeer, Nicole Rusk, Tyler Funnell, Marc J Williams, Daniel Lai, Mirela Andronescu, Kieran R. Campbell, Andrew McPherson, Samuel Aparicio, Andrew Roth, Sohrab Shah, and Alexandre Bouchard-Côté. Cancer phylogenetic tree inference at scale from 1000s of single cell genomes (2023). bioRxiv, 2020.05.06.058180, ver. 4 peer-reviewed and recommended by Peer Community in Mathematical and Computational Biology. [2] Sohrab Salehi, Farhia Kabeer, Nicholas Ceglia, Mirela Andronescu, Marc J. Williams, Kieran R. Campbell, Tehmina Masud, Beixi Wang, Justina Biele, Jazmine Brimhall, David Gee, Hakwoo Lee, Jerome Ting, Allen W. Zhang, Hoa Tran, Ciara O’Flanagan, Fatemeh Dorri, Nicole Rusk, Teresa Ruiz de Algara, So Ra Lee, Brian Yu Chieh Cheng, Peter Eirew, Takako Kono, Jenifer Pham, Diljot Grewal, Daniel Lai, Richard Moore, Andrew J. Mungall, Marco A. Marra, IMAXT Consortium, Andrew McPherson, Alexandre Bouchard-Côté, Samuel Aparicio & Sohrab P. Shah. Clonal fitness inferred from time-series modelling of single-cell cancer genomes (2021). Nature 595, 585–590. https://doi.org/10.1038/s41586-021-03648-3 | Cancer phylogenetic tree inference at scale from 1000s of single cell genomes | Sohrab Salehi, Fatemeh Dorri, Kevin Chern, Farhia Kabeer, Nicole Rusk, Tyler Funnell, Marc J Williams, Daniel Lai, Mirela Andronescu, Kieran R. Campbell, Andrew McPherson, Samuel Aparicio, Andrew Roth, Sohrab Shah, and Alexandre Bouchard-Côté | <p style="text-align: justify;">A new generation of scalable single cell whole genome sequencing (scWGS) methods allows unprecedented high resolution measurement of the evolutionary dynamics of cancer cell populations. Phylogenetic reconstruction ... | | Evolutionary Biology, Genetics and population Genetics, Genomics and Transcriptomics, Machine learning, Probability and statistics | Amaury Lambert | 2021-12-10 17:08:04 |


