
Recommendation
The paper [1] presents and applies a new Bayesian inference method of phylogenetic reconstruction for multiple sequence alignments in the case of low sequencing coverage but diverse copy number aberrations (CNA), with applications to single cell sequencing of tumors.
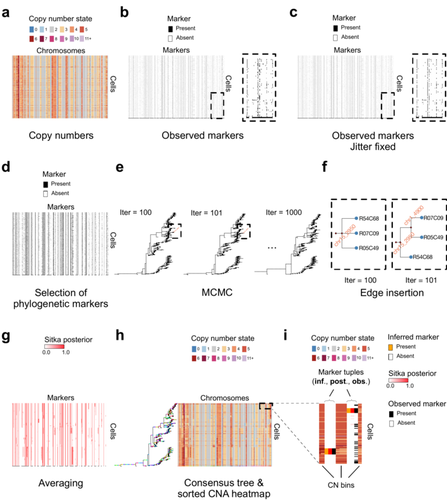
The idea is to take advantage of CNA to reconstruct the topology of the phylogenetic tree of sequenced cells in a first step (the `sitka' method), and in a second step to assign single nucleotide variants (SNV) to tree edges (and then calibrate their lengths) (the `sitka-snv' method).
The data are summarized into a binary-valued CxL matrix Y, where C is the number of cells and L is the number of loci (here, loci are segments of prescribed length called `bins'). The entry of Y at row i and column j is 1 (otherwise 0) iff in the ancestral lineage of cell i, at least one genomic rearrangement has occurred, and more specifically the gain or loss of a segment with at least one endpoint in locus j or in locus j+1. The authors expect the infinite-allele assumption to approximately hold (i.e., that at most one mutation occurs at any given marker and that 0 is the ancestral state). They refer to this assumption as the `perfect phylogeny assumption'. By only recording from CNA events the endpoints at which they occur, the authors lose the information on copy number, but they gain the assumption of independence of the mutational processes occurring at different sites, which approximately holds for CNA endpoints.
The goal of sitka is to produce a posterior distribution on phylogenetic trees conditional on the matrix Y , where here a phylogenetic tree is understood as containing the information on 1) the topology of the tree but not its edge lengths, and 2) for each edge, the identity of markers having undergone a mutation, in the sense of the previous paragraph.
The results of the method are tested against synthetic datasets simulated under various assumptions, including conditions violating the perfect phylogeny assumption and compared to results obtained under other baseline methods. The method is extended to assign SNV to edges of the tree inferred by sitka. It is also applied to real datasets of single cell genomes of tumors.
The manuscript is very well-written, with a high degree of detail. The method is novel, scalable, fast and appears to perform favorably compared to other approaches. It has been applied in independent publications, for example to multi-year time-series single-cell whole-genome sequencing of tumors, in order to infer the fitness landscape and its dynamics through time, see [2].
The reviewing process has taken too long, mainly because of other commitments I had during the period and to the difficulty of finding reviewers. Let me apologize to the authors and thank them for their patience as well as for the scientific rigor they brought to their revisions and answers to reviewers, who I also warmly thank for their quality work.
REFERENCES
[1] Sohrab Salehi, Fatemeh Dorri, Kevin Chern, Farhia Kabeer, Nicole Rusk, Tyler Funnell, Marc J Williams, Daniel Lai, Mirela Andronescu, Kieran R. Campbell, Andrew McPherson, Samuel Aparicio, Andrew Roth, Sohrab Shah, and Alexandre Bouchard-Côté. Cancer phylogenetic tree inference at scale from 1000s of single cell genomes (2023). bioRxiv, 2020.05.06.058180, ver. 4 peer-reviewed and recommended by Peer Community in Mathematical and Computational Biology.
https://doi.org/10.1101/2020.05.06.058180
[2] Sohrab Salehi, Farhia Kabeer, Nicholas Ceglia, Mirela Andronescu, Marc J. Williams, Kieran R. Campbell, Tehmina Masud, Beixi Wang, Justina Biele, Jazmine Brimhall, David Gee, Hakwoo Lee, Jerome Ting, Allen W. Zhang, Hoa Tran, Ciara O’Flanagan, Fatemeh Dorri, Nicole Rusk, Teresa Ruiz de Algara, So Ra Lee, Brian Yu Chieh Cheng, Peter Eirew, Takako Kono, Jenifer Pham, Diljot Grewal, Daniel Lai, Richard Moore, Andrew J. Mungall, Marco A. Marra, IMAXT Consortium, Andrew McPherson, Alexandre Bouchard-Côté, Samuel Aparicio & Sohrab P. Shah. Clonal fitness inferred from time-series modelling of single-cell cancer genomes (2021). Nature 595, 585–590. https://doi.org/10.1038/s41586-021-03648-3
DOI or URL of the preprint: https://doi.org/10.1101/2020.05.06.058180
Version of the preprint: 3
Dear Reviewers,
Thank you for your feedback and comments. I have updated our bioRxiv submission to version 4 and attached additional comments in a PDF here.
Best,
Kevin Chern
Dear Sohrab Salehi,
I would like to thank you and your co-authors for your work on revising your manuscript according to the reviewer's comments and to mine.
We are all satisfied with this new version, except for a few minor points that I encourage you to address before final recommendation. This should not take you too much time as a whole. Please address in particular the first point raised by the reviewer regarding SCARLET and either benchmark this method or argue better in favor of not doing it.
As far as I am concerned, I sincerely acknowledge your efforts in expanding explanations (best possible tree, proxy of violation rate + a wealth of terms and phrases) and adding new analyses: comparison with new methods and assessment of within-site pairwise dependencies - I appreciated your idea of getting rid of one of the two extremities of a segment that was gained or lost. However, here and in various other tests (violation of perfect phylogeny assumption, violation of infinite-site assumption), you seem to be reluctant to simulate the real biological process of CNA, as I had suggested in my report. Can you please explain me why?
Last point: line 610, it sounds a little weird to speak of the "three noise regimes" before explaining (in section 9.5.3) what they are.
I will try and write my recommendation soon after I receive your answer/revision.
Sincerely,
Amaury Lambert
My questions and comments have largely been addressed by the authors. There are a few remaining comments I would like to make in response:
1. In their response to my comment 5, in which I suggested to include SCARLET in the benchmark of methods, the authors wrote
"Rationale of choice of additional baselines: sitka is designed for shallow sequencing regimes where calling SNVs per cell would be difficult, but copy numbers can be called reliably. In such cases, most SNVs will not be called in most cells. However SCARLET, while correcting for CNAs, requires the same SNV to be called in all cells."
I am a bit surprised by this, since the SCARLET method explicitly accounts for allele drop-outs, i.e. missing SNV calls in some cells (cited from Satas et al., 2020):
"Data from scDNA-seq typically have high error rates in identifying SNVs, and particularly high rates of false negatives and missing data due to amplification bias and allele dropout (Gawad et al., 2016). SCARLET models these errors using a beta-binominal distribution (Singer et al., 2018) of the observed read counts."
Further, in the SCARLET paper, the model was applied to a dataset from Leung et al. (2017), which has the following properties (cited from Satas et al., 2020):
"This data-set included targeted sequencing of 1,000 genes in 141 cells from a primary colon tumor and 45 cells from a matched liver metastasis (Figure 4A). The authors identified 36 SNVs and used SCITE (Jahn et al., 2016) to derive a perfect phylogeny from these SNVs (Figure 4B)."
These properties sounds very comparable to one of the cohorts, Eirew et al. (2015), that were analyzed in the current study:
"DNA was prepared from 90 individual SA501 xenograft nuclei from passages X1, X2 and X4, and the variant allele ratios were determined by targeted ultra-deep sequencing at 45 somatic SNV and 10 germline SNV positions."
Hence, I somewhat fail to see why the comparison to SCARLET was not even tried.
2. I did not find a reference for the OVA dataset, even though it is not stated that that dataset was specifically generated for this study (as with the SA535 dataset).
3. The authors further argued that the differences in performance between methods might be driven in part by the fact that some algorithms do not converge in the "available computational budget (several days)." I think it would be necessary to define the criteria for the allowed algorithm runtime/computational budget very clearly if runtime is such a crucial factor for performance. In other words, even though of course algorithm runtime is an important practical feature, the benchmark is supposed to measure accuracy, ideally after convergence and independent of runtime. If this cannot be achieved, it should be pointed out that the other methods may have achieved higher accuracy with a longer runtime.
4. Regarding my comment 6, I apologize for having failed to formulate the question in a manner that would have allowed the authors to understand and answer it properly. Even though the figure caption may have been a bit spartan, I would argue it was reasonably obvious that the previous Fig. 1f showed the insets from panel 1e. My question about what is now Fig. 3f regarded the (extinct) leaves without cells (i.e. those that do not have blue circles at the end). There are two such leaves in the box denoting iteration 100 and one in the box of iteration 101. Are these the unseen wild-type states of the marker events? Why are there two such extinct lines associated with just one marker (chr12_1600) in the left box? The process that happens in the upper part of the plot exactly corresponds to the description of the edge insertion process in the Methods section. However, it is not clear why in addition both the topology of the tree in the bottom part (presumably unaffected by the edge insertion) and the marker ID itself are changed (assuming each marker/red diamond is associated with its nearest orange text descriptor).
References:
Eirew, P., Steif, A., Khattra, J., Ha, G., Yap, D., Farahani, H., ... & Aparicio, S. (2015). Dynamics of genomic clones in breast cancer patient xenografts at single-cell resolution. Nature, 518(7539), 422-426.
Leung, M. L., Davis, A., Gao, R., Casasent, A., Wang, Y., Sei, E., ... & Navin, N. E. (2017). Single-cell DNA sequencing reveals a late-dissemination model in metastatic colorectal cancer. Genome research, 27(8), 1287-1299.
Satas, G., Zaccaria, S., Mon, G., & Raphael, B. J. (2020). SCARLET: single-cell tumor phylogeny inference with copy-number constrained mutation losses. Cell Systems, 10(4), 323-332.
https://doi.org/10.24072/pci.mcb.100112.rev21DOI or URL of the preprint: https://doi.org/10.1101/2020.05.06.058180
Version of the preprint: 2
Dear Sohrab Salehi,
We have received 3 reviews, two of which are enthusiastic about your work but request revisions before final recommendation.
Please see my detailed decision in attachment,
Best wishes,
Amaury Lambert
Download recommender's annotationsIn this manuscript, the authors introduce a novel, scalable method to infer phylogenies from single-cell whole-genome sequencing data based on copy number information. The algorithm is applied to three independent datasets and the goodness-of-fit compared to other methods. Possible violations of the model assumptions are discussed and put in context of real-world data. After tree inference, SNV data can be incorporated into the model prediction as well. The manuscript is very well written and the method appears to be fast and to perform favorably compared to other approaches.
I would first like to commend the authors on the clarity of the majority of their manuscript and the high degree of detail. It was a pleasure to read it. I am further providing my detailed feedback and questions below.
1. Based on Eq. 2, it appears like the sampling probability of a vertex v is both proportional to the likelihood of each sub-tree, expressed by p(y|x(t),theta), as well as the number of possible sub-trees. The latter implies that vertices with many children are more likely to be sampled than trees with fewer children. Is this correct? Is this desired?
2. How does the equation following l. 398, which posits that the probability p(y_{c,l}|x_{c,l},theta) of a vertex can be expressed as the product of probabilities of all its children, relate to the original definition of p(y_{c,l}|x_{c,l},theta) given after l. 322, according to which children and parent nodes are independent?
3. The transformation given in the equation after l. 413, which results in a product over k factors, contains all possibilities for edge insertions in sub-tree v, including the one in which no edge is inserted. Hence, vertices whose existing configuration already has a high likelihood are, counterintuitively, selected for edge insertion proportionately to this likelihood. I can imagine that, at best, this would slow the convergence of the algorithm, but there might be more deleterious consequences.
4. Regarding the inference of the consensus tree (section 9.4.5), I am not sure I understand well Eq. 6. It appears the authors are using a generalized Bayes estimator by minimizing the posterior expected loss, as the loss function is weighted with the posterior distribution that is given after l. 365. Is this correct? Second, it appears that then the parameter t in the argument of pi should be t'. Third, why did the authors choose to use the Bayes risk to determine the tree, especially since it appears that the priors for t and theta are anyway largely non-informative? Could they not just maximize the likelihood p(y|x(t), theta)?
5. In the benchmarking (Fig. 2d), I think the authors should compare their method also to other existing methods, in particular SCARLET from ref. [17] and MEDALT from ref. [18]. In this regard, I also find it interesting that a simple hierarchical clustering method, UPGMA, shows such good performance, which is even largely better than that of MrBayes, when using Youden's index as a measure. Do the authors know why this would be so? Could it be that the performance measure is suboptimal?
6. Fig. 1f shows leaves without cells or markers. Why and how are these generated in the MCMC tree exploration scheme?
7. Along similar lines, in l. 101 of the manuscript is stated that "Markers placed at the leaves are interpreted as outliers, for example measured CN change points that are false positives. We remove from the type I tree all marker nodes that are leaf nodes, i.e., markers that are not present in any cells." Would it not be possible to always place a marker that was observed in only one cell at the leaf corresponding to that cell? Also, why are such outliers still observed (e.g. CN change points that are false positives) if columns in y with relative density across cells less than 5% were removed (l. 314)?
8. In the computation of p(y|x,theta) on p. 10, all entries (c,l) are assumed independent. However, change points should be correlated with some auto-correlation function with a decay rate proportional to the typical CN lengths, i.e. Cov(y_{c,l}, y_{c,l'})!=0. Would it be feasible to incorporate this kind of information in the algorithm?
9. It appears like the FN and FP rates could be optimized instead of set to default values (0.5 and 0.1, respectively). Are these defaults informed or are they arbitrary?
10. Regarding the number of possible trees derived after l. 352, how come the second factor in the second line of the equation is (|L|+1)^|C|? Should there not be (L+1)!/(L+1-C)! possibilities to assign |C| cells to |L|+1 vertices?
11. In l. 356ff., it is stated "This simple prior has a useful property: if a collection of say two splits are supported by m1 and m2 traits, then the prior probability for an additional trait to support the first versus second split is proportional to (m1 + 1, m2 + 1). Therefore, there is a “rich gets richer” behaviour built-in into the prior". How is this compatible with the prior being a uniform prior (cf. l. 353 and formula)?
https://doi.org/10.24072/pci.mcb.100112.rev11PCI Math Comp Biol #112
Cancer phylogenetic tree inference at scale from 1000s of single cell genomes
by Salehi et al.
This paper develops a new method for phylogenetic modeling and Bayesian inference of cancer evolution that suggests being efficient when applied to tens of thousands of high-resolution genomes from single cell whole genome sequencing (scWGS).
I think that the method clearly shows utility, but that it is not entirely clear whether it outperforms alternative approaches. This, however, is mentioned in the manuscript. The study of synthetic experiments helps readers to navigate the method and evaluated its impact and future utility, especially in light of cell removal due to contamination. I am intersted in seeing future applications of this method.
https://doi.org/10.24072/pci.mcb.100112.rev12The authors of the manuscript present a new method for reconstructing single cell phylogenies from previously inferred CNV data. Specifically, they propose a data transformation for CNV counts into discretized coarse grained markers of changes, based on which the phylogenetic reconstruction is performed efficiently.
Importantly, the authors also propose a single point mutation calling method that conditions on the CNV based phylogenies to better resolve signal to noise problem.
The method is compared to other state of art methods on three single cell datasets.
The methods and algorithms are comprehensively presented. In general, the manuscript would benefit from introducing more explanatory comments and brief motivations for introducing steps of the analysis, especially in the Results section (e.g. why do we need type I and type II trees, what is the benefit of using change points, or even definition of perfect phylogeny) so that non-expert readers can follow.
However, I do have a major concern about the property of the sitka transformation and the effect it has on the phylogeny recontruction that the authors should adress. Each copy number variations comes with 2 breakpoints. The sitka transformation, to my understanding, ends up treating copy number changes along the chromosome as independent events, and, effectively, the markers of the beginning and the end of a copy number variation are not paired. What is the impact of this on the phylogenies? Are the pairs of breakpoints separated on the reconstructed phylogenies? If so, how distant they are? The authors should discuss this point and present the relevant statistics on empirical data.
https://doi.org/10.24072/pci.mcb.100112.rev13