
Recommendation
 based on reviews by 2 anonymous reviewers
We often use genetic data from a single site, or even a single individual, to estimate the history of effective population size, Ne, over time scales in excess of a million years. Mazet and Noûs [2] emphasize that such estimates may not mean what they seem to mean. The ups and downs of Ne may reflect changes in gene flow or selection, rather than changes in census population size. In fact, gene flow may cause Ne to decline even if the rate of gene flow has remained constant.
Consider for example the estimates of archaic population size in Fig. 1, which show an apparent decline in population size between roughly 700 kya and 300 kya. It is tempting to interpret this as evidence of a declining number of individuals, but that is not the only plausible interpretation.
Each of these estimates is based on the genome of a single diploid individual. As we trace the ancestry of that individual backwards into the past, the ancestors are likely to remain in the same locale for at least a generation or two. Being neighbors, there’s a chance they will mate. This implies that in the recent past, the ancestors of a sampled individual lived in a population of small effective size.
As we continue backwards into the past, there is more and more time for the ancestors to move around on the landscape. The farther back we go, the less likely they are to be neighbors, and the less likely they are to mate. In this more remote past, the ancestors of our sample lived in a population of larger effective size, even if neither the number of individuals nor the rate of gene flow has changed.
For awhile then, Ne should increase as we move backwards into the past. This process does not continue forever, because eventually the ancestors will be randomly distributed across the population as a whole. We therefore expect Ne to increase towards an asymptote, which represents the effective size of the entire population.
This simple story gets more complex if there is change in either the census size or the rate of gene flow. Mazet and Noûs [2] have shown that one can mimic real estimates of population history using models in which the rate of gene flow varies, but census size does not. This implies that the curves in Fig. 1 are ambiguous. The observed changes in Ne could reflect changes in census size, gene flow, or both.
For this reason, Mazet and Noûs [2] would like to replace the term “effective population size” with an alternative, the “inverse instantaneous coalescent rate,” or IIRC. I don’t share this preference, because the same critique could be made of all definitions of Ne. For example, Wright [3, p. 108] showed in 1931 that Ne varies in response to the sex ratio, and this implies that changes in Ne need not involve any change in census size. This is also true when populations are geographically structured, as Mazet and Noûs [2] have emphasized, but this does not seem to require a new vocabulary.

Figure 1: PSMC estimates of the history of population size based on three archaic genomes: two Neanderthals and a Denisovan [1].
Mazet and Noûs [2] also show that estimates of Ne can vary in response to selection. It is not hard to see why such an effect might exist. In genomic regions affected by directional or purifying selection, heterozygosity is low, and common ancestors tend to be recent. Such regions may contribute to small estimates of recent Ne. In regions under balancing selection, heterozygosity is high, and common ancestors tend to be ancient. Such regions may contribute to large estimates of ancient Ne. The magnitude of this effect presumably depends on the fraction of the genome under selection and the rate of recombination.
In summary, this article describes several processes that can affect estimates of the history of effective population size. This makes existing estimates ambiguous. For example, should we interpret Fig. 1 as evidence of a declining number of archaic individuals, or in terms of gene flow among archaic subpopulations? But these questions also present research opportunities. If the observed decline reflects gene flow, what does this imply about the geographic structure of archaic populations? Can we resolve the ambiguity by integrating samples from different locales, or using archaeological estimates of population density or interregional trade?
REFERENCES
[1] Fabrizio Mafessoni et al. “A high-coverage Neandertal genome from Chagyrskaya Cave”. Proceedings of the National Academy of Sciences, USA 117.26 (2020), pp. 15132–15136. https://doi.org/10.1073/pnas.2004944117
[2] Olivier Mazet and Camille Noûs. “Population genetics: coalescence rate and demographic parameters inference”. arXiv, ver. 2 peer-reviewed and recommended by Peer Community In Mathematical and Computational Biology (2023). https://doi.org/10.48550/ARXIV.2207.02111.
[3] Sewall Wright. “Evolution in mendelian populations”. Genetics 16 (1931), pp. 97–159. https://doi.org/10.48550/ARXIV.2207.0211110.1093/genetics/16.2.97.
The authors have validated most of the minor/stylistic suggestions made by the reviewers, which I think resulted in an overall improvement of the manuscript. Regarding the more general comments that were made:
a- the bibliographic survey is more comprehensive and credits a number of studies/ideas from various research groups, which also is an improvement;
b- my suggestion of roughly quantifying how problematic it is to ignore population structure (by showing that most populations indeed depart the panmixy assumption to an extent expected to seriously bias inferences) was not really followed, but this was admittedly an uneasy to deal with comment - maybe a subject for another article, actually;
c- the section on natural selection was substantially improved and now gives a pertinent description of the underlying rationale.
Regarding item c above, I have an additional, minor comment: the text says that "portions of the genome undergo a recurrent higher impact of selection due to their local gene content or recombination rate"; actually gene content determines the strength of selection, and recombination rate determines the width of the genomic region expected to be affected. I find the sentence to be a little bit misleading in suggesting that the two forces were more or less interchangeable. I would suggest either dropping the mention to recombination or writing "and recombination rate" instead of "or recombination rate".
Overall I think the authors invested a great deal of effort in improving the manuscript based on the reviewers' comments, making it a valuable addition to the literature.
https://doi.org/10.24072/pci.mcb.100150.rev21
DOI or URL of the preprint: https://doi.org/10.48550/arXiv.2207.02111
Version of the preprint: 1
, posted 16 Sep 2022Attached.
Download recommender's annotationsThis preprint reviews general aspects of the coalescence theory in population genetics, then focusses on recent work by the authors on modeling and interpretating the variation in coalescence rate across loci measured from genome-wide data.
This is indeed an assumed choice by the authors, and one maybe questionable since not only them have contributed to this field, obviously. Yet the authors have been (among) the first to clearly identify and demonstrate the naivety of the typical, single-pop interpretation of PSMC patterns, which has dominated the field for years. They have a well-articulated message on this problem, and propose new developments for an informed interpretation of this kind of analysis, which all revolve around the IICR formalism they have introduced. For this reason I think this piece is a valuable addition to the literature. Yet I would encourage the authors to mention similar/related developents made by other groups, if any. It should be noted that the authors use a generic author name (with the exception of a junior scientist), which indicates that this contribution is not intended to inflate their bibliometric stats.
My other general comment would be about the importance of the problem in practice. Ignoring population structure is only a problem if populations are structured, and sufficiently so that the IICR is substantially affected. So a naive question would be: are typical natural populations sufficiently structured for the problem to be serious? I am pretty sure the ansewer is yes, and indeed some of the authors' papers address this, but I feel like this review could be an opportunity to make kind of a general agument here. Could the authors give an idea, maybe based on reviews of the empirical literature, of what proportion of analyses are expected to be seriously flawed vs. more or less robust to this problem? Even a broad picture would be a plus in my opinion.
Finally I have a number of point-by-point comments/suggestions which I hope might help improve the clarity of this important, well-done manuscript.
- [p1; section 1; paragraph 2] "until successive common ancestors are found"
-> sounds like an awkward process-ending condition to me; maybe "until a common ancestor is found" ?
- [p1; section 1; paragraph 3] "The mathematical objects of interest..."
-> I think I would use singular instead of plural ("The mathematical object of interest is the joint distribution...")
-> "express [...] as a function of [...]" : maybe just "predict"?
-> this sentence more or less implies that the whole coalescence process is entirely described by coalescence times, whereas, one could say, tree topology also matters (e.g. you don't expect the same SFS depending on whether tree is symetrical vs. pectinated, as soon as n>3); "coalescence times" and "tree" are often taken as synonyms in the ms; maybe clarify by adding a section/sentence about tree topology, its distribution and independence with respect to demography and selection?
-> this sentence mentions "a family tree", suggesting that we're here considering a single locus, whereas the previous paragraph mentions "loci", and the next sentence mentions recombination as a relevant parameter, implying several loci - could the text be more consistent with this respect?
- [fig1 legend]
-> "in the past" -> "ago"? (twice)
- the first three equations of p3 are not numbered
- [p3, second equation]
-> I am not sure every reader will know the "floor" symbol so would suggest defining it (or dropping it)
- [p3, third equation]
-> Tk and t in the third equation are not expressed in the same unit as Tk and t in the second equation (2N generations vs. generations), but the same symbols were kept
- overall I fell like the treatment of time scale normalization by Ne could be improved; it is introduced very lightly in the first equations, then recalled in several sections, sometimes in a lenghty way
- [p3, last section] "The absence of the panmictic assumption" -> "To relax the assumption of panmixy" ?
- [p4, first section] "assuming that the sizes of each population are sufficiently large" -> "assuming that populations are sufficiently large" ?
- equation 3: I do not understand why the left-hand term is not Q(alpha,beta) instead of Q(n_alpha,n_beta); I do not understand what these n_alpha and n_beta terms represent; I am apparently missing a level of complexity here
- [p4, "Mutation and genetic diversity" section] Reference to Tajima's D probably misplaced here. Tajima's D is a statistic that combines two estimators of 4Ne.mu (topic of the section) to learn about deviations from the standard coalescent. Maybe the intended reference is Tajima 1983 Genetics 105:437 ?
- [p6, first section] the key sentence starting "Considering that..." seems to lack a verb
- [p6, middle, first consequence ("The sole data...")] I would suggest being explicit and replacing "demographic model" with "population structure". At first reading I mentally interpreted "demographic model" as "model of Ne change in a single pop", thus missing the point. I know this is because I'm biased in a priori considering a single pop when thinking coalescent. Still I might not be alone, and given the importance of the sentence I would suggest avoiding any ambiguity.
- [p8] "so the matrices can be time dependent as piecewise constant functions" -> "so the matrices can be piecewise constant functions of time" ?
- [p10] "it is natural to want to increase" -> I would suggest rephrasing as "A natural way to increase the precision of the estimation of demographic parameters is to increase the sample size."
- [p13, middle]: "this rate being linked to the reproductive capacity"; this seems confusing, and the nature of the link is unclear; there is no such a thing as distinct portions of a genome differing in their "reproductive capacities"; instead a genomic portion hosts genes at which distinct alleles conferring distinct reproductive capacities to their carriers used to appear and segregate, affecting the IICR; the sentence seems to entail a simple link between coalescence rate and the strength of selection, whereas in reality things are more complicated; for instance both selective sweeps (positive s) and background selection (negative s) tend to reduced coalescence times. Maybe instead "this rate being linked to the selective regime at work"?
- Section 4 could discuss the appropriateness of modeling linked selection via a variable Ne across the genome. Selection has some intrinsic property of being variable in time, whereas the model presented here assumes a constant in time coalescence rate in any portion of the genome. For instance selective sweeps are expected to induce brief periods of very high coalescence rate (eg see papers by Barton, Hermisson, Petrov, Jensen and many others), i.e., affect the shape of genealogies and the IICR in a way not easily captured by the model used here. This model however is probably great in capturing the across-genome variations in constant-in-time selective regime, e.g. regions under balancing selection vs regions under recurrent background selection. Overall I feel like connecting section 4 a bit more firmly to the (heavy) body of literature on selection detection in pop genomics would be a great addition. Note that these considerations on tree shape essentially disappear when sample size=2, which is still often the case in PSMC-related literature, and this could also be mentionned as a justification for the approach presented here.
- [last section] in addition to Charlesworth 2009 the authors might like to cite the recent Waples 2022 J Hered 113:371
https://doi.org/10.24072/pci.mcb.100150.rev11
In this manuscript, Oliver Mazet and “Camille Noûs” summarize important recent work on how population structure and selection bias PSMC estimates. In these studies, it has been shown that the PSMC actually estimates the inverse of the instantaneous coalescence rate (IICR), which captures the distribution of coalescence times along the genome. Changes in the IICR only directly correspond to changes in the effective population size in a panmictic population, but not if the population is structured. This has important implications because PSMC is often applied to genomes of humans and other species to infer demographic histories, and PSMC plots are usually interpreted as changes in the effective population size. Therefore it is critical to know which processes shape PSMC estimates and in which ways. Because of this, a review of recent developments in this direction will be useful to the broader scientific community. The equations described throughout this manuscript appear to be correct.
However, as presently written, this manuscript largely focuses on a decade of work from a single research group. It would benefit greatly from being reworked as either a primer on how to interpret PSMC results, or as a review paper that covers the work of additional research groups. An additional issue is that this manuscript can be improved for clarity. It is not always clear why certain concepts are introduced or discussed and where the text is leading to. An additional improvement would be to reduce the number of figures (as some are a little redundant).
A central point of this manuscript is that changes of IIRC inferred by PSMC should only be cautiously interpreted as actual changes in effective population sizes (Ne) if one is confident that the panmictic model holds. However, Ne != N. This distinction between Ne & N should be made explicit throughout the manuscript, as sometimes the term “population size” is used in a blurry ways. The utility of this paper would be significantly increased if the author(s) were to further discuss how different evolutionary and demographic processes can shape Ne/IIRC and PSMC plots.
Please, ensure to cite previous relevant work at all appropriate positions throughout the text. Sometimes it is not clear which study is discussed (e.g., discussion of Figure 7 on Page 9). Also other relevant computational tools for inferring population structure and changes in IICR should be cited (e.g., SMC++ and diCAL).
Additional suggestions and queries are listed below:
Page 1: I appreciate that the authors are up-front about being an anonymous collective (“Camille Noûs”). However, I think this can be shortened or even mentioned in a footnote. If the goal of give credit to other members of a research team, why not name them explicitly in an acknowledgements section at the end of the manuscript?
Page 1: The first paragraph can be more informative about the contents of this manuscript. Furthermore, the second paragraph of the paper should be more specific about what the problem is (i.e., that population structure affects PSMC estimates) and how recent work has tried to address the problem. Doing so will help guide the reader to know what is coming later in this manuscript. Following the previous comment, the review of coalescence theory is a bit lengthy and it is not always clear why these concepts are introduced. It may be good to give a brief introduction first, elaborating on the problem addressed by the reviewed work and setting up the following sections. This will make it easier for the reader to follow and see how each subsection relates to the bigger picture.
Page 4: The interpretations of the conditions in Eq. 3 should be provided.
Pager 5: Recent years have seen advances in the application of ARGs. It would be a good idea to add some citations in this regard, and perhaps go into additional detail about the strength and weaknesses of ARGs.
Page 7: I understand that Figure 3 was taken from another publication but simulation parameters in the figure legend would be helpful. Also please add a citation to the original paper in the Figure 3 legend so that one knows it is not an original result. Similar suggestions hold for subsequent figures.
Pages 7 and 9 (related to Figure 5): What exact models were simulated? I get that they are described in detail in Chikhi et al. 2018 but the reader shouldn’t need to go to the original publication to understand what is simulated.
Page 9 (related of Figure 7). This is an interesting point. It might be worth going into more detail, and providing the relevant citation.
Page 10: Computation of the IICR_k: This is interesting theory but why is introduced? Was it applied to data yet? If yes, what were the results?
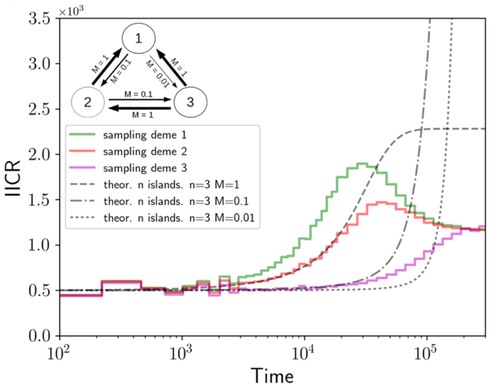
Page 11: In Figure 8, please define what a component is in the figure legend. What are the units of t and M?
Page 13: The discussion of the SFS comes out of the blue and it is not entirely clear how it fits into the broader context. As such, it could be deleted without harming the paper.
