
Recommendation
Soraggi et al. [2] describe HMMploidy, a statistical method that takes DNA sequencing data as input and uses a hidden Markov model to estimate ploidy. The method allows ploidy to vary not only between individuals, but also between and even within chromosomes. This allows the method to detect aneuploidy and also chromosomal regions in which multiple paralogous loci have been mistakenly assembled on top of one another.
HMMploidy estimates genotypes and ploidy simultaneously, with a separate estimate for each genome. The genome is divided into a series of non-overlapping windows (typically 100), and HMMploidy provides a separate estimate of ploidy within each window of each genome. The method is thus estimating a large number of parameters, and one might assume that this would reduce its accuracy. However, it benefits from large samples of genomes. Large samples increase the accuracy of internal allele frequency estimates, and this improves the accuracy of genotype and ploidy estimates. In large samples of low-coverage genomes, HMMploidy outperforms all other estimators. It does not require a reference genome of known ploidy. The power of the method increases with coverage and sample size but decreases with ploidy. Consequently, high coverage or large samples may be needed if ploidy is high.
The method is slower than some alternative methods, but run time is not excessive. Run time increases with number of windows but isn't otherwise affected by genome size. It should be feasible even with large genomes, provided that the number of windows is not too large. The authors apply their method and several alternatives to isolates of a pathogenic yeast, Cryptococcus neoformans, obtained from HIV-infected patients. With these data, HMMploidy replicated previous findings of polyploidy and aneuploidy. There were several surprises. For example, HMMploidy estimates the same ploidy in two isolates taken on different days from a single patient, even though sequencing coverage was three times as high on the later day as on the earlier one. These findings were replicated in data that were down-sampled to mimic low coverage.
Three alternative methods (ploidyNGS [1], nQuire, and nQuire.Den [3]) estimated the highest ploidy considered in all samples from each patient. The present authors suggest that these results are artifactual and reflect the wide variation in allele frequencies. Because of this variation, these methods seem to have preferred the model with the largest number of parameters. HMMploidy represents a new and potentially useful tool for studying variation in ploidy. It will be of most use in studying the genetics of asexual organisms and cancers, where aneuploidy imposes little or no penalty on reproduction. It should also be useful for detecting assembly errors in de novo genome sequences from non-model organisms.
References
[1] Augusto Corrêa dos Santos R, Goldman GH, Riaño-Pachón DM (2017) ploidyNGS: visually exploring ploidy with Next Generation Sequencing data. Bioinformatics, 33, 2575–2576. https://doi.org/10.1093/bioinformatics/btx204
[2] Soraggi S, Rhodes J, Altinkaya I, Tarrant O, Balloux F, Fisher MC, Fumagalli M (2022) HMMploidy: inference of ploidy levels from short-read sequencing data. bioRxiv, 2021.06.29.450340, ver. 6 peer-reviewed and recommended by Peer Community in Mathematical and Computational Biology. https://doi.org/10.1101/2021.06.29.450340
[3] Weiß CL, Pais M, Cano LM, Kamoun S, Burbano HA (2018) nQuire: a statistical framework for ploidy estimation using next generation sequencing. BMC Bioinformatics, 19, 122. https://doi.org/10.1186/s12859-018-2128-z
DOI or URL of the preprint: https://www.biorxiv.org/content/10.1101/2021.06.29.450340v4
Version of the preprint: 4
 , posted 06 Aug 2022
I'm ready to recommend this preprint. But before doing so, I want to give the authors an opportunity to respond to one remaining issue. See attached.
Download recommender's annotationsDOI or URL of the preprint: https://www.biorxiv.org/content/10.1101/2021.06.29.450340v3
Version of the preprint: 3
, posted 06 May 2022See attached.
Download recommender's annotationsDOI or URL of the preprint: https://doi.org/10.1101/2021.06.29.450340
Version of the preprint: 2
, posted 13 Sep 2022See attached
Download recommender's annotations, 18 Jan 2022I found the manuscript to be substantially improved in many respects, and would like to thak the authors for the hard work and willingness to address all the reviewers' remarks. I still have a couple of questions.
1. From the authors' response and corrections, it is my understanding that the HMMploidy method is intended to be applied to segments across which ploidy does not vary. This is perceptible from the modified introduction, in which the emphasis is put on aneuploidy (i.e., single-ploidy chromosomes), and the simulation part, in which constant ploidy is assumed. This is a perfectly valid goal, but one might then ask, why taking an HMM approach? If ploidy is assumed to be constant then the likelihood can probably be calculated based on the provided equations without the HMM layer. The authors might like to clarify the choice an HMM apporach if ploidy is supposed not to change across the analyzed segments.
2. The section on the empirical analysis is still a bit unclear to me. In particular:
- do we have external knowledge on the real level of (aneu)ploidy in these samples?
- I don't quite understand the interpretation of the CCTP27 vs CCTP27-d121 discrepancy. In this genome the sequencing depth of chromosome 12 was tripled at day 121, compared to the reference at day 0, suggesting some major biological event. HMMploidy infers the same ploidy (of 1) for chromosome 12 in the two samples, thus missing this biological event as far as I understand it. Still, this is interpreted as a success of the method.
The authors might like to clarify their specific goals with this analysis, and what kind of biological pattern or structure they are targetting. If the idea is to identify polyploid segments having accumulated a certain amount of sequence variation, as seems implicit in the empirical analysis section, then this should probably be stated more explicitly and discussed.
https://doi.org/10.24072/pci.mcb.100109.rev21
DOI or URL of the preprint: https://www.biorxiv.org/content/10.1101/2021.06.29.450340v1
Version of the preprint: 1
, posted 31 Jul 2021My letter is attached.
Download recommender's annotationsIn this paper, Soraggi et al. introduce a new model for inferring the ploidy of an organism from low-coverage sequence data using genotype likelihoods. This seems like an useful program; but the current manuscript requires substantial revising and editing to make it suitable for publication.
Major points:
1. Introduction: I think the authors should define better what they mean with ploidy, particularly when we talk about ploidy at the sub-chromosome level, and how the authors expect it to differ from structural variation. I.e. I can think of cases like the pseudo-autosomal-region in humans and crazy systems like the platypus X-chromosome; but it would be nice to be explicit about this, I assume it has somehow to do with homologous recombination?
2. Why are coverage-based methods not considered in comparisons? In ancient DNA, sexing is often done by comparing the ploidy of the X-chromosome. This works well at coverages < 0.01x, so I don't understand why these approaches wouldn't work on sufficiently large ploidy-regions. I would imagine at least aneuploidies would be easy to discover with those approaches as well. This needs to be better justified.
3. Why does the probability on the rhs of equation 2 not depend on i? Also, why does one not have to correct for the abundance of alleles? I.e. if we have a tetraploid and the genotype is AAAG, why would the probability of seeing As and Gs be equal? I think Equation 2 as stated is simply wrong, and if not, needs to be much better motivated.
4. So is the only signal considered in G the heterozygosity? Could that be confounded with population structure?
5. I do not think that essentially copying half the paper to the supplement is a good idea. It just makes the manuscript unnecessarily bloated. Why not reduce the supplement to p 4 and 5 which do the heavy lifting. That little care has been given to this arrangement is also apparent that the main text refers to superflues equations in the supplement
6. Section 2.3: Is reference/sequencing bias an issue here?
Minor:
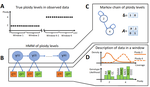
Fig 1: I am a bit confused by panel A. What do the little dots represent? Is the unit a window or a SNP?
p3. why would HWE lead to a negative binomial distribution?
p5. (eq 4) would be good to label equation numbers in the supplement seperately. Also, why can't one use the main text equations here?
p5. (m-th HMM) should that mean m-th hidden state?) otherwise I don't understand this section
p6. The difference between EM and ECM should be explained. Also, in the Baum-Welch-algorithm I am familiar with, the Forward-Backward Algorithm is the E-step of the EM; so what exactly is the EM for each forward-backwards run calculating expectations over?
p6. why is overfitting sets of ploidy levels a concern? How is the number of ploidy levels defined/constrained in the first place?
Typos:
p2 incorporates
p3 (lower case) letters
across reads
In general, the English is quite poor and requires further editing. Also line numbers would greatly help pointing out typos and issues more specifically. This is compounded by the issue that the paper is at times jargon heavy (e.g. Tower property, Markov matrix) and worse, the jargon is not explained and used inconsistently (Markov matrix vs Transition matrix).
, 09 Jul 2021
This manuscript introduces a method for inferring ploidy and its variation across genomes and loci based on next-generation sequencing data. The main novelty is the introduction of a hidden Markov Model (HMM) in which ploidy is assumed to vary across genomic windows. Ploidy is an important aspect of genome structure, and underlies key technical challenges of genome assembly and analysis, so this manuscript, in my opinion, addresses an important problem. I like much the idea of explicitly modelling ploidy variation and the resulting predictions on patterns of sequence coverage and base counts. I think that the HMMploidy approach has a great potential of significantly advancing the field. That said, I have a number of concerns regarding the manuscript, both content and form, which I detail below. Briefly, I do not think the approach is particularly well motivated or illustrated, I have technical issued with the maths and the way the method is presented, and a suggestion of improvement regarding sequence coverage modeling.
A. Awkward/insufficient justification of the method:
It is not totally intuitive why HMM would be appropriate to model ploidy, since ploidy is typically thought of as a constant, for a given species. In reality, the realized ploidy can vary across chromosomes or chromosomal regions and/or between individuals, making the HMM approach a promising one. The introduction very briefly mentions aneuploidy in cancer cells, and polyploidization in plants, as two possible instances of variable ploidy. The manuscript, however, does not develop on these examples, and rather presents (i) an analysis of data simulated in the absence of any variation in ploidy, and (ii) an analysis of a data set in Cryptococcus neoformans, introduced with very limited biological context. I did not find that the HMMploidy method performs particularly well in these two analyses. It was not obviously better than competing methods in the simulation benchmark, and failed to detect a conspicuous instance of triploidy in the real data analysis.
There are a number of reasons why ploidy is expected to vary among/across assembled genomes that are not mentioned or considered in the manuscript. The realized ploidy can be locally increased due to large-scale duplications, when several distinct regions of a genome are so similar that they are assembled as a single piece. Counting gene copy number is indeed a difficult problem (eg see papers by Schrider and Hahn). Another typical artefact with genome assembly is allele splitting, when heterozygosity is so high that assembling algorithms separate homologus alleles as if they were distinct loci (eg have a look at papers on the Ciona savignyi and Adineta vaga genomes, or the recent liteature on haplotig detection and cleaning). The HMMploidy approach seems to be a promising way to identify, annotate and possibly filter ou such anomalous genomic regions. Another example of varying ploidy that comes to my mind are sex chromosomes, which are haploid in the heterogametic sex (male in XY systems, female in ZW systems) and diploid in the homogametic sex (see for instance papers by Muyle, Kafer and Marais on how to annotate sex-chromosome-associated contigs). Please note that in many systems (eg mammals) the Y/W chromosome is actually a mosaic of ploidy, with so-called pseudo-autosomal regions being diploid while the sex-specific region is haploid. Each of the topics I'm mentioning in this paragraph is the subject of a voluminous literature.
I would suggest (i) strenghtening the introduction by discussing in more detail why among-loci variation in ploidy is actually relevant, thus justifying the HMM approach, and (ii) identifying a couple of real data sets with clear expectations regarding ploidy variation, and demonstrate the applicability and added value of the newly introduced method.
B. Awkward/inaccurate presentation of the method:
I have several concerns with the way the method is presented, which I think mostly result from insufficient clarity. At any rate at the moment I can't say I totally understand what the method exactly does, and the manuscript apparently contains incorrect equations.
- 2.1 first sentence: "N polymorphic sites"; how do we know a site is polymorphic or not prior to the analysis? Should one perform SNP calling beforehand? Maybe remove "polymorphic"?
- 2.1: a genotype is described as the number of "alternate (or derived) alleles", suggesting that SNPs are assumed to be polarized. I do not think that the method presented here requires SNP polarization (which is good), so I would suggest clarifying.
- 2.1: "We assume Hardy-Weinberg equilibrium (HWE) and thus model the genotype probability with a negative binomial distribution" -> I would rather think a binomial distribution?
- 2.2: Equation 2 appears awkward. The summation variable i does not appear in the term right to the Sigma symbol, which is suggestive of a problem. Also a genotype G_mn was defined above as an integer taking value in {0, ..., Y_mn}, but here appears the idea that O_mnr (some observed nucleotide) can be "in G_mn" (second part of equation 2), which is inconsistent.
I guess one could re-define a genotype as a vector of nucleotide instead of an integer, then replace in equation 2
p(O_mnr|G_mn,Q_mnr,Y_mn)
with
p(O_mnr|G_mni,Q_mnr,Y_mn)
and replace in second line of equation 2
"if O_mnr in G_mn"
with
"if O_mnr = G_mni"
Alternatively one could keep the text definition of genotype, call A_n and a_n the two alleles at locus n (say), and replace in equation 2:
sum_i p(Omnr|G_mn,Q_mnr,Y_mn)/Y_mn
with
((1-G_mn) p(O_mnr|A_n,Q_mnr,Y_mn) + G_mn p(O_mnr|a_n,Q_mnr,Y_mn))/Y_mn
and adjust second line of equation 2.
The above two options, which I think are equivalent (but different from the text), are what makes sense to me. In the rest of this review I'm assuming that the calculation that was actually made corresponds to the above modified equations.
- 2.3: equation 3 is a rather complex way of saying that the estimated alternate allele frequency is the observed alternate allele frequency across all reads from the pooled genome sample. Indeed Fhat_mn in equation 3 can be written as f_mn/C_mn, where f_mn is the observed number of alternate alleles in genome m, so C_mn cancels out and we get Fhat_n=sum(f_mn)/C_n.
[now switching to Supplementary Material]
- 6.5: I am not sure what alpha and beta are. I guess these correspond to the shape and scale parameter of the Poisson-Gamma distribution of mean coverage across windows - this should be specified. Secondly, I do not understand why these parameters appear with a _k index, suggesting there is one alpha and one beta per window. The text and figure S1 instead suggest that there is one value of coverage per window, C_m(k), drawn from a unique Poisson-Gamma distribution, the parameters of which should be shared across windows?
C. Modeling scheme:
The way sequencing coverage is modeled lacks clarity and justification. Irrespective of ploidy, there might be differences in coverage among loci (e.g. GC-rich vs GC-poor regions) and among genomes (due to experimental setting or the experimental noise). It would appear natural to me to model the among-loci variation in coverage as suggested in the ms, to also model among-genomes variation in coverage (i.e., introduce genome specific coverage parameters), and to define C_m(k) as the product of these two terms - thus assuming that the locus-effect and the genome-effect are independent. If one thinks this is too strong an assumption, maybe some (de)correlation parameter could be introduced. My understanding of the current method is that the across_loci distribution of coverage is assumed to be independent across genomes, i.e., the fact that one locus is highly covered in one genome says nothing about coverage at the same locus in another genome. This sounds like an highly, maybe overly, versatile model, which I think might induce some loss of signal. For instance, the analysis of chromosome 12 in the Cryptococcus CCTP27-d121 sample did not detect any change in ploidy even though coverage is consistently tripled across a large portion of the chromosome (fig 2). I suggest that if coverage was modeled in a more constrained way - i.e. as the product of a genome-specific and a locus-specific term - this abnormality could be interpreted by the method as a triplication. A clarification of how coverage is modeled across loci and genomes, a discussion of this question, and an attempt to adopt a less versatile scheme, would appear required.
D. Minor
- section 3: "averaged by the polyploid genome size" -> "divided by genome size" ?
- Simulations: section 3 says that ploidy 1 to 20 have been simulated, but the result section and figure 2 only consider ploidy 1 to 5.
- Discussion: "On the former point, rescaling sequencing depth across genomes is not possible since HMMploidy models a distribution of read counts." -> I do not understand this sentence.
https://doi.org/10.24072/pci.mcb.100109.rev12
