
Latest recommendations

| Id | Title * | Authors * | Abstract * | Picture * | Thematic fields * ▲ | Recommender | Reviewers | Submission date | |
|---|---|---|---|---|---|---|---|---|---|
21 Feb 2022
Consistency of orthology and paralogy constraints in the presence of gene transfersAllowing gene transfers doesn't make life easier for inferring orthology and paralogyRecommended by Barbara Holland based on reviews by 2 anonymous reviewersDetermining if genes are orthologous (i.e. homologous genes whose most common ancestor represents a speciation) or paralogous (homologous genes whose most common ancestor represents a duplication) is a foundational problem in bioinformatics. For instance, the input to almost all phylogenetic methods is a sequence alignment of genes assumed to be orthologous. Understanding if genes are paralogs or orthologs can also be important for assigning function, for example genes that have diverged following duplication may be more likely to have neofunctionalised or subfunctionalised compared to genes that have diverged following speciation, which may be more likely to have continued in a similar role. This paper by Jones et al (2022) contributes to a wide range of literature addressing the inference of orthology/paralogy relations but takes a different approach to explaining inconsistency between an assumed species phylogeny and a relation graph (a graph where nodes represent genes and edges represent that the two genes are orthologs). Rather than assuming that inconsistencies are the result of incorrect assessment of orthology (i.e. incorrect edges in the relation graph) they ask if the relation graph could be consistent with a species tree combined with some amount of lateral (horizontal) gene transfer. The two main questions addressed in this paper are (1) if a network N and a relation graph R are consistent, and (2) if – given a species tree S and a relation graph R – transfer arcs can be added to S in such a way that it becomes consistent with R? The first question hinges on the concept of a reconciliation between a gene tree and a network (section 2.1) and amounts to asking if a gene tree can be found that can both be reconciled with the network and consistent with the relation graph. The authors show that the problem is NP hard. Furthermore, the related problem of attempting to find a solution using k or fewer transfers is NP-hard, and also W[1] hard implying that it is in a class of problems for which fixed parameter tractable solutions have not been found. The proof of NP hardness is by reduction to the k-multi-coloured clique problem via an intermediate problem dubbed “antichain on trees” (Section 3). The “antichain on trees” construction may be of interest to others working on algorithmic complexity with phylogenetic networks. In the second question the possible locations of transfers are not specified (or to put it differently any time consistent transfer arc is considered possible) and it is shown that it generally will be possible to add transfer edges to S in such a way that it can be consistent with R. However, the natural extension to this question of asking if it can be done with k or fewer added arcs is also NP hard. Many of the proofs in the paper are quite technical, but the authors have relegated a lot of this detail to the appendix thus ensuring that the main ideas and results are clear to follow in the main text. I am grateful to both reviewers for their detailed reviews and through checking of the proofs. References Jones M, Lafond M, Scornavacca C (2022) Consistency of orthology and paralogy constraints in the presence of gene transfers. arXiv:1705.01240 [cs], ver. 6 peer-reviewed and recommended by Peer Community in Mathematical and Computational Biology. https://arxiv.org/abs/1705.01240 | Consistency of orthology and paralogy constraints in the presence of gene transfers | Mark Jones, Manuel Lafond, Celine Scornavacca | <p style="text-align: justify;">Orthology and paralogy relations are often inferred by methods based on gene sequence similarity that yield a graph depicting the relationships between gene pairs. Such relation graphs frequently contain errors, as ... | | Computational complexity, Design and analysis of algorithms, Evolutionary Biology, Graph theory | Barbara Holland | 2021-06-30 15:01:44 | ||
19 Sep 2022
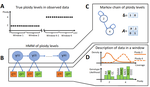
HMMploidy: inference of ploidy levels from short-read sequencing dataDetecting variation in ploidy within and between genomesRecommended by Alan Rogers based on reviews by Barbara Holland, Benjamin Peter and Nicolas Galtier based on reviews by Barbara Holland, Benjamin Peter and Nicolas Galtier
Soraggi et al. [2] describe HMMploidy, a statistical method that takes DNA sequencing data as input and uses a hidden Markov model to estimate ploidy. The method allows ploidy to vary not only between individuals, but also between and even within chromosomes. This allows the method to detect aneuploidy and also chromosomal regions in which multiple paralogous loci have been mistakenly assembled on top of one another. HMMploidy estimates genotypes and ploidy simultaneously, with a separate estimate for each genome. The genome is divided into a series of non-overlapping windows (typically 100), and HMMploidy provides a separate estimate of ploidy within each window of each genome. The method is thus estimating a large number of parameters, and one might assume that this would reduce its accuracy. However, it benefits from large samples of genomes. Large samples increase the accuracy of internal allele frequency estimates, and this improves the accuracy of genotype and ploidy estimates. In large samples of low-coverage genomes, HMMploidy outperforms all other estimators. It does not require a reference genome of known ploidy. The power of the method increases with coverage and sample size but decreases with ploidy. Consequently, high coverage or large samples may be needed if ploidy is high. The method is slower than some alternative methods, but run time is not excessive. Run time increases with number of windows but isn't otherwise affected by genome size. It should be feasible even with large genomes, provided that the number of windows is not too large. The authors apply their method and several alternatives to isolates of a pathogenic yeast, Cryptococcus neoformans, obtained from HIV-infected patients. With these data, HMMploidy replicated previous findings of polyploidy and aneuploidy. There were several surprises. For example, HMMploidy estimates the same ploidy in two isolates taken on different days from a single patient, even though sequencing coverage was three times as high on the later day as on the earlier one. These findings were replicated in data that were down-sampled to mimic low coverage. Three alternative methods (ploidyNGS [1], nQuire, and nQuire.Den [3]) estimated the highest ploidy considered in all samples from each patient. The present authors suggest that these results are artifactual and reflect the wide variation in allele frequencies. Because of this variation, these methods seem to have preferred the model with the largest number of parameters. HMMploidy represents a new and potentially useful tool for studying variation in ploidy. It will be of most use in studying the genetics of asexual organisms and cancers, where aneuploidy imposes little or no penalty on reproduction. It should also be useful for detecting assembly errors in de novo genome sequences from non-model organisms. References [1] Augusto Corrêa dos Santos R, Goldman GH, Riaño-Pachón DM (2017) ploidyNGS: visually exploring ploidy with Next Generation Sequencing data. Bioinformatics, 33, 2575–2576. https://doi.org/10.1093/bioinformatics/btx204 [2] Soraggi S, Rhodes J, Altinkaya I, Tarrant O, Balloux F, Fisher MC, Fumagalli M (2022) HMMploidy: inference of ploidy levels from short-read sequencing data. bioRxiv, 2021.06.29.450340, ver. 6 peer-reviewed and recommended by Peer Community in Mathematical and Computational Biology. https://doi.org/10.1101/2021.06.29.450340 [3] Weiß CL, Pais M, Cano LM, Kamoun S, Burbano HA (2018) nQuire: a statistical framework for ploidy estimation using next generation sequencing. BMC Bioinformatics, 19, 122. https://doi.org/10.1186/s12859-018-2128-z | HMMploidy: inference of ploidy levels from short-read sequencing data | Samuele Soraggi, Johanna Rhodes, Isin Altinkaya, Oliver Tarrant, Francois Balloux, Matthew C Fisher, Matteo Fumagalli | <p>The inference of ploidy levels from genomic data is important to understand molecular mechanisms underpinning genome evolution. However, current methods based on allele frequency and sequencing depth variation do not have power to infer ploidy ... | | Design and analysis of algorithms, Evolutionary Biology, Genetics and population Genetics, Probability and statistics | Alan Rogers | 2021-07-01 05:26:31 | ||
09 Nov 2023
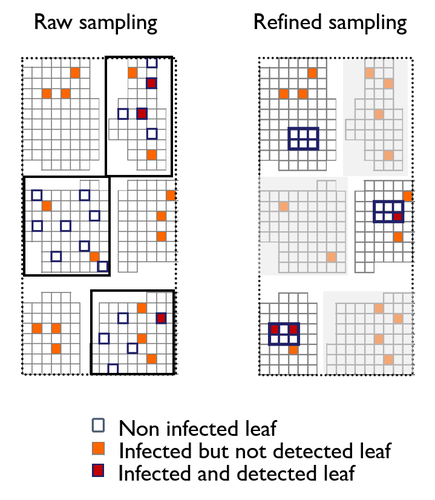
A mechanistic-statistical approach to infer dispersal and demography from invasion dynamics, applied to a plant pathogenA mechanistic-statistical approach for the field-based study of invasion dynamicsRecommended by Hirohisa Kishino based on reviews by 2 anonymous reviewers
To study the annual invasion of a tree pathogen (Melampsora larici-populina, a fungal species responsible for the poplar rust disease), Xhaard et al (2012) had conducted a spatiotemporal survey along the Durance River valley in the French Alps over nearly 200 km, measuring sampled leaves and twigs from 40 to 150 trees at 12 evenly spaced study sites at seven-time points. By combining Bayesian genetic assignment and a landscape epidemiology approach, they were able to estimate the genetic origin and annual spread of the plant pathogen during a single epidemic. The observed temporal variation in the spatial pattern of infection rates allowed Saubin et al (2023) to estimate the key factors that determine the speed of the invasion dynamics. In particular, it is crucial to estimate the probability and extent of long-distance dispersal. The dynamics of the macroscale population density was formulated by the reaction-diffusion (R.D.) model and by the integro-difference (I.D.) model. Both consist of the diffusion/dispersal component and the reaction component. In the I.D. model, the kernel function represents the distribution of the dispersion. The likelihood function was obtained by coupling the mathematical model of the population dynamics and the statistical model of the observational process. Saubin et al (2023) considered a thin-tailed Gaussian kernel, a heavy-tailed exponential kernel, and a fat-tailed exponential power kernel. The numerical simulation reflecting the above survey confirmed the identifiability of the propagation kernel and the accuracy of the parameter estimation. In particular, the above survey had the high power to identify the model with frequent long-distance dispersal. The data from the survey selected the exponential power kernel with confidence. The mean dispersal distance was estimated to be 2.01 km. The exponential power was 0.24. This parameter value predicts that 5% of the dispersals will have a distance > 14.3 km and 1% will have a distance > 36.0 km. The mechanistic-statistical approach presented here may become a new standard for the field-based studies of invasion dynamics. References Saubin, M., Coville, J., Xhaard, C., Frey, P., Soubeyrand, S., Halkett, F., and Fabre, F. (2023). A mechanistic-statistical approach to infer dispersal and demography from invasion dynamics, applied to a plant pathogen. bioRxiv, ver. 5 peer-reviewed and recommended by Peer Community in Mathematical and Computational Biology. https://doi.org/10.1101/2023.03.21.533642 Xhaard, C., Barrès, B., Andrieux, A., Bousset, L., Halkett, F., and Frey, P. (2012). Disentangling the genetic origins of a plant pathogen during disease spread using an original molecular epidemiology approach. Molecular Ecology, 21(10):2383-2398. https://doi.org/10.1111/j.1365-294X.2012.05556.x | A mechanistic-statistical approach to infer dispersal and demography from invasion dynamics, applied to a plant pathogen | Méline Saubin, Jérome Coville, Constance Xhaard, Pascal Frey, Samuel Soubeyrand, Fabien Halkett, Frédéric Fabre | <p style="text-align: justify;">Dispersal, and in particular the frequency of long-distance dispersal (LDD) events, has strong implications for population dynamics with possibly the acceleration of the colonisation front, and for evolution with po... | | Dynamical systems, Ecology, Epidemiology, Probability and statistics | Hirohisa Kishino | 2023-05-10 09:57:25 | ||
13 Dec 2021
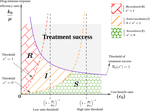
Within-host evolutionary dynamics of antimicrobial quantitative resistanceModelling within-host evolutionary dynamics of antimicrobial resistanceRecommended by Krasimira Tsaneva based on reviews by 2 anonymous reviewersAntimicrobial resistance (AMR) arises due to two main reasons: pathogens are either intrinsically resistant to the antimicrobials, or they can develop new resistance mechanisms in a continuous fashion over time and space. The latter has been referred to as within-host evolution of antimicrobial resistance and studied in infectious disease settings such as Tuberculosis [1]. During antibiotic treatment for example within-host evolutionary AMR dynamics plays an important role [2] and presents significant challenges in terms of optimizing treatment dosage. The study by Djidjou-Demasse et al. [3] contributes to addressing such challenges by developing a modelling approach that utilizes integro-differential equations to mathematically capture continuity in the space of the bacterial resistance levels. Given its importance as a major public health concern with enormous societal consequences around the world, the evolution of drug resistance in the context of various pathogens has been extensively studied using population genetics approaches [4]. This problem has been also addressed using mathematical modelling approaches including Ordinary Differential Equations (ODE)-based [5. 6] and more recently Stochastic Differential Equations (SDE)-based models [7]. In [3] the authors propose a model of within-host AMR evolution in the absence and presence of drug treatment. The advantage of the proposed modelling approach is that it allows for AMR to be represented as a continuous quantitative trait, describing the level of resistance of the bacterial population termed quantitative AMR (qAMR) in [3]. Moreover, consistent with recent experimental evidence [2] integro-differential equations take into account both, the dynamics of the bacterial population density, referred to as “bottleneck size” in [2] as well as the evolution of its level of resistance due to drug-induced selection. The model proposed in [3] has been extensively and rigorously analysed to address various scenarios including the significance of host immune response in drug efficiency, treatment failure and preventive strategies. The drug treatment chosen to be investigated in this study, namely chemotherapy, has been characterised in terms of the level of evolved resistance by the bacterial population in presence of antimicrobial pressure at equilibrium. Furthermore, the minimal duration of drug administration on bacterial growth and the emergence of AMR has been probed in the model by changing the initial population size and average resistance levels. A potential limitation of the proposed model is the assumption that mutations occur frequently (i.e. during growth), which may not be necessarily the case in certain experimental and/or clinical situations. References [1] Castro RAD, Borrell S, Gagneux S (2021) The within-host evolution of antimicrobial resistance in Mycobacterium tuberculosis. FEMS Microbiology Reviews, 45, fuaa071. https://doi.org/10.1093/femsre/fuaa071 [2] Mahrt N, Tietze A, Künzel S, Franzenburg S, Barbosa C, Jansen G, Schulenburg H (2021) Bottleneck size and selection level reproducibly impact evolution of antibiotic resistance. Nature Ecology & Evolution, 5, 1233–1242. https://doi.org/10.1038/s41559-021-01511-2 [3] Djidjou-Demasse R, Sofonea MT, Choisy M, Alizon S (2021) Within-host evolutionary dynamics of antimicrobial quantitative resistance. HAL, hal-03194023, ver. 4 peer-reviewed and recommended by Peer Community in Mathematical and Computational Biology. https://hal.archives-ouvertes.fr/hal-03194023 [4] Wilson BA, Garud NR, Feder AF, Assaf ZJ, Pennings PS (2016) The population genetics of drug resistance evolution in natural populations of viral, bacterial and eukaryotic pathogens. Molecular Ecology, 25, 42–66. https://doi.org/10.1111/mec.13474 [5] Blanquart F, Lehtinen S, Lipsitch M, Fraser C (2018) The evolution of antibiotic resistance in a structured host population. Journal of The Royal Society Interface, 15, 20180040. https://doi.org/10.1098/rsif.2018.0040 [6] Jacopin E, Lehtinen S, Débarre F, Blanquart F (2020) Factors favouring the evolution of multidrug resistance in bacteria. Journal of The Royal Society Interface, 17, 20200105. https://doi.org/10.1098/rsif.2020.0105 [7] Igler C, Rolff J, Regoes R (2021) Multi-step vs. single-step resistance evolution under different drugs, pharmacokinetics, and treatment regimens (BS Cooper, PJ Wittkopp, Eds,). eLife, 10, e64116. https://doi.org/10.7554/eLife.64116 | Within-host evolutionary dynamics of antimicrobial quantitative resistance | Ramsès Djidjou-Demasse, Mircea T. Sofonea, Marc Choisy, Samuel Alizon | <p style="text-align: justify;">Antimicrobial efficacy is traditionally described by a single value, the minimal inhibitory concentration (MIC), which is the lowest concentration that prevents visible growth of the bacterial population. As a conse... | | Dynamical systems, Epidemiology, Evolutionary Biology, Medical Sciences | Krasimira Tsaneva | 2021-04-16 16:55:19 | ||
04 Feb 2022
Non-Markovian modelling highlights the importance of age structure on Covid-19 epidemiological dynamicsImportance of age structure on modeling COVID-19 epidemiological dynamicsRecommended by Chen Liao based on reviews by Facundo Muñoz, Kevin Bonham and 1 anonymous reviewerCOVID-19 spread around the globe in early 2020 and has deeply changed our everyday life [1]. Mathematical models allow us to estimate R0 (basic reproduction number), understand the progression of viral infection, explore the impacts of quarantine on the epidemic, and most importantly, predict the future outbreak [2]. The most classical model is SIR, which describes time evolution of three variables, i.e., number of susceptible people (S), number of people infected (I), and number of people who have recovered (R), based on their transition rates [3]. Despite the simplicity, SIR model produces several general predictions that have important implications for public health [3]. SIR model includes three populations with distinct labels and is thus compartmentalized. Extra compartments can be added to describe additional states of populations, for example, people exposed to the virus but not yet infectious. However, a model with more compartments, though more realistic, is also more difficult to parameterize and analyze. The study by Reyné et al. [4] proposed an alternative formalism based on PDE (partial differential equation), which allows modeling different biological scenarios without the need of adding additional compartments. As illustrated, the authors modeled hospital admission dynamics in a vaccinated population only with 8 general compartments. The main conclusion of this study is that the vaccination level till 2021 summer was insufficient to prevent a new epidemic in France. Additionally, the authors used alternative data sources to estimate the age-structured contact patterns. By sensitivity analysis on a daily basis, they found that the 9 parameters in the age-structured contact matrix are most variable and thus shape Covid19 pandemic dynamics. This result highlights the importance of incorporating age structure of the host population in modeling infectious diseases. However, a relevant potential limitation is that the contact matrix was assumed to be constant throughout the simulations. To account for time dependence of the contact matrix, social and behavioral factors need to be integrated [5]. References [1] Hu B, Guo H, Zhou P, Shi Z-L (2021) Characteristics of SARS-CoV-2 and COVID-19. Nature Reviews Microbiology, 19, 141–154. https://doi.org/10.1038/s41579-020-00459-7 [2] Jinxing G, Yongyue W, Yang Z, Feng C (2020) Modeling the transmission dynamics of COVID-19 epidemic: a systematic review. The Journal of Biomedical Research, 34, 422–430. https://doi.org/10.7555/JBR.34.20200119 [3] Tolles J, Luong T (2020) Modeling Epidemics With Compartmental Models. JAMA, 323, 2515–2516. https://doi.org/10.1001/jama.2020.8420 [4] Reyné B, Richard Q, Noûs C, Selinger C, Sofonea MT, Djidjou-Demasse R, Alizon S (2022) Non-Markovian modelling highlights the importance of age structure on Covid-19 epidemiological dynamics. medRxiv, 2021.09.30.21264339, ver. 3 peer-reviewed and recommended by Peer Community in Mathematical and Computational Biology. https://doi.org/10.1101/2021.09.30.21264339 [5] Bedson J, Skrip LA, Pedi D, Abramowitz S, Carter S, Jalloh MF, Funk S, Gobat N, Giles-Vernick T, Chowell G, de Almeida JR, Elessawi R, Scarpino SV, Hammond RA, Briand S, Epstein JM, Hébert-Dufresne L, Althouse BM (2021) A review and agenda for integrated disease models including social and behavioural factors. Nature Human Behaviour, 5, 834–846 https://doi.org/10.1038/s41562-021-01136-2 | Non-Markovian modelling highlights the importance of age structure on Covid-19 epidemiological dynamics | Bastien Reyné, Quentin Richard, Camille Noûs, Christian Selinger, Mircea T. Sofonea, Ramsès Djidjou-Demasse, Samuel Alizon | <p style="text-align: justify;">The Covid-19 pandemic outbreak was followed by a huge amount of modelling studies in order to rapidly gain insights to implement the best public health policies. Most of these compartmental models involved ordinary ... | | Dynamical systems, Epidemiology, Systems biology | Chen Liao | 2021-10-04 13:49:51 | ||
07 Dec 2021
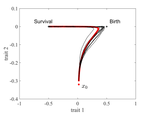
The emergence of a birth-dependent mutation rate in asexuals: causes and consequencesA new perspective in modeling mutation rate for phenotypically structured populationsRecommended by Yuan Lou based on reviews by Hirohisa Kishino and 1 anonymous reviewerIn standard mutation-selection models for describing the dynamics of phenotypically structured populations, it is often assumed that the mutation rate is constant across the phenotypes. In particular, this assumption leads to a constant diffusion coefficient for diffusion approximation models (Perthame, 2007 and references therein). Patout et al (2021) study the dependence of the mutation rate on the birth rate, by introducing some diffusion approximations at the population level, derived from the large population limit of a stochastic, individual-based model. The reaction-diffusion model in this article is of the “cross-diffusion” type: The form of “cross-diffusion” also appeared in ecological literature as a type of biased movement behaviors for organisms (Shigesada et al., 1979). The key underlying assumption for “cross-diffusion” is that the transition probability at the individual level depends solely upon the condition at the departure point. Patout et al (2021) envision that a higher birth rate yields more mutations per unit of time. One of their motivations is that during cancer development, the mutation rates of cancer cells at the population level could be correlated with reproduction success. The reaction-diffusion approximation model derived in this article illustrates several interesting phenomena: For the time evolution situation, their model predicts different solution trajectories under various assumptions on the fitness function, e.g. the trajectory could initially move towards the birth optimum but eventually end up at the survival optimum. Their model also predicts that the mean fitness could be flat for some period of time, which might provide another alternative to explain observed data. At the steady-state level, their model suggests that the populations are more concentrated around the survival optimum, which agrees with the evolution of the time-dependent solution trajectories. Perhaps one of the most interesting contributions of the study of Patout et al (2021) is to give us a new perspective to model the mutation rate in phenotypically structured populations and subsequently, and to help us better understand the connection between mutation and selection. More broadly, this article offers some new insights into the evolutionary dynamics of phenotypically structured populations, along with potential implications in empirical studies. References Perthame B (2007) Transport Equations in Biology Frontiers in Mathematics. Birkhäuser, Basel. https://doi.org/10.1007/978-3-7643-7842-4_2 Patout F, Forien R, Alfaro M, Papaïx J, Roques L (2021) The emergence of a birth-dependent mutation rate in asexuals: causes and consequences. bioRxiv, 2021.06.11.448026, ver. 3 peer-reviewed and recommended by Peer Community in Mathematical and Computational Biology. https://doi.org/10.1101/2021.06.11.448026 Shigesada N, Kawasaki K, Teramoto E (1979) Spatial segregation of interacting species. Journal of Theoretical Biology, 79, 83–99. https://doi.org/10.1016/0022-5193(79)90258-3 | The emergence of a birth-dependent mutation rate in asexuals: causes and consequences | Florian Patout, Raphaël Forien, Matthieu Alfaro, Julien Papaïx, Lionel Roques | <p style="text-align: justify;">In unicellular organisms such as bacteria and in most viruses, mutations mainly occur during reproduction. Thus, genotypes with a high birth rate should have a higher mutation rate. However, standard models of asexu... | | Dynamical systems, Evolutionary Biology, Probability and statistics, Stochastic dynamics | Yuan Lou | Anonymous, Hirohisa Kishino | 2021-06-12 13:59:45 | |
27 Jul 2021
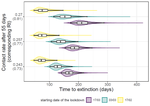
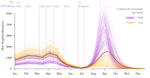
Estimating dates of origin and end of COVID-19 epidemicsThe importance of model assumptions in estimating the dynamics of the COVID-19 epidemicRecommended by Valery Forbes based on reviews by Bastien Boussau and 1 anonymous reviewerIn “Estimating dates of origin and end of COVID-19 epidemics”, Bénéteau et al. develop and apply a mathematical modeling approach to estimate the date of the origin of the SARS-CoV-2 epidemic in France. They also assess how long strict control measures need to last to ensure that the prevalence of the virus remains below key public health thresholds. This problem is challenging because the numbers of infected individuals in both tails of the epidemic are low, which can lead to errors when deterministic models are used. To achieve their goals, the authors developed a discrete stochastic model. The model is non-Markovian, meaning that individual infection histories influence the dynamics. The model also accounts for heterogeneity in the timing between infection and transmission and includes stochasticity as well as consideration of superspreader events. By comparing the outputs of their model with several alternative models, Bénéteau et al. were able to assess the importance of stochasticity, individual heterogeneity, and non-Markovian effects on the estimates of the dates of origin and end of the epidemic, using France as a test case. Some limitations of the study, which the authors acknowledge, are that the time from infection to death remains largely unknown, a lack of data on the heterogeneity of transmission among individuals, and the assumption that only a single infected individual caused the epidemic. Despite the acknowledged limitations of the work, the results suggest that cases may be detected long before the detection of an epidemic wave. Also, the approach may be helpful for informing public health decisions such as the necessary duration of strict lockdowns and for assessing the risks of epidemic rebound as restrictions are lifted. In particular, the authors found that estimates of the end of the epidemic following lockdowns are more sensitive to the assumptions of the models used than estimates of its beginning. In summary, this model adds to a valuable suite of tools to support decision-making in response to disease epidemics. References Bénéteau T, Elie B, Sofonea MT, Alizon S (2021) Estimating dates of origin and end of COVID-19 epidemics. medRxiv, 2021.01.19.21250080, ver. 3 peer-reviewed and recommended by Peer Community in Mathematical and Computational Biology. https://doi.org/10.1101/2021.01.19.21250080 | Estimating dates of origin and end of COVID-19 epidemics | Thomas Bénéteau, Baptiste Elie, Mircea T. Sofonea, Samuel Alizon | <p style="text-align: justify;">Estimating the date at which an epidemic started in a country and the date at which it can end depending on interventions intensity are important to guide public health responses. Both are potentially shaped by simi... | | Epidemiology, Probability and statistics, Stochastic dynamics | Valery Forbes | 2021-02-23 16:37:32 | ||
22 Jul 2024
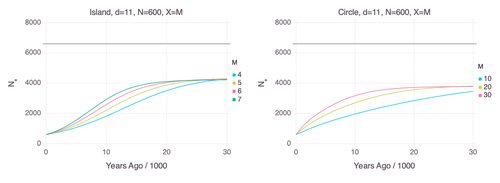
Genetic Evidence for Geographic Structure within the Neanderthal PopulationDecline in Neanderthal effective population size due to geographic structure and gene flowRecommended by Raquel Assis based on reviews by David Bryant and Guillaume AchazPublished PSMC estimates of Neanderthal effective population size (𝑁e) show an approximately five-fold decline over the past 20,000 years [1]. This observation may be attributed to a true decline in Neanderthal 𝑁e, statistical error that is notorious with PSMC estimation, or geographic subdivision and gene flow that has been hypothesized to occur within the Neanderthal population. Determining which of these factors contributes to the observed decline in Neanderthal 𝑁e is an important question that can provide insight into human evolutionary history. Though it is widely believed that the decline in Neanderthal 𝑁e is due to geographic subdivision and gene flow, no prior studies have theoretically examined whether these evolutionary processes can yield the observed pattern. In this paper [2], Rogers tackles this problem by employing two mathematical models to explore the roles of geographic subdivision and gene flow in the Neanderthal population. Results from both models show that geographic subdivision and gene flow can indeed result in a decline in 𝑁e that mirrors the observed decline estimated from empirical data. In contrast, Rogers argues that neither statistical error in PSMC estimates nor a true decline in 𝑁e are expected to produce the consistent decline in estimated 𝑁e observed across three distinct Neanderthal fossils. Statistical error would likely result in variation among these curves, whereas a true decline in 𝑁e would produce shifted curves due to the different ages of the three Neanderthal fossils. In summary, Rogers provides convincing evidence that the most reasonable explanation for the observed decline in Neanderthal 𝑁e is geographic subdivision and gene flow. Rogers also provides a basis for understanding this observation, suggesting that 𝑁e declines over time because coalescence times are shorter between more recent ancestors, as they are more likely to be geographic neighbors. Hence, Rogers’ theoretical findings shed light on an interesting aspect of human evolutionary history. References [1] Fabrizio Mafessoni, Steffi Grote, Cesare de Filippo, Svante Pääbo (2020) “A high-coverage Neandertal genome from Chagyrskaya Cave”. Proceedings of the National Academy of Sciences USA 117: 15132- 15136. https://doi.org/10.1073/pnas.2004944117 [2] Alan Rogers (2024) “Genetic evidence for geographic structure within the Neanderthal population”. bioRxiv, version 4 peer-reviewed and recommended by Peer Community in Mathematical and Computational Biology. https://doi.org/10.1101/2023.07.28.551046 | Genetic Evidence for Geographic Structure within the Neanderthal Population | Alan R. Rogers | <p>PSMC estimates of Neanderthal effective population size (N<sub>e</sub>)exhibit a roughly 5-fold decline across the most recent 20 ky before the death of each fossil. To explain this pattern, this article develops new theory relating... | | Evolutionary Biology, Genetics and population Genetics | Raquel Assis | 2023-10-17 18:06:38 | ||
10 Jan 2024
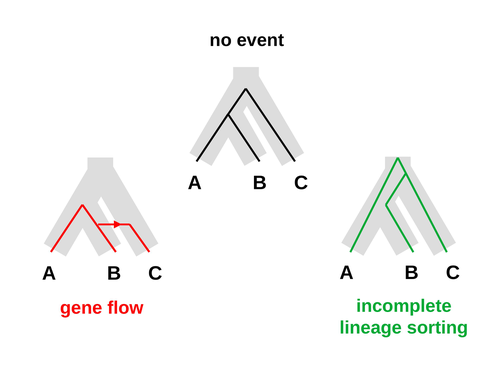
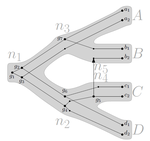
An approximate likelihood method reveals ancient gene flow between human, chimpanzee and gorillaAphid: A Novel Statistical Method for Dissecting Gene Flow and Lineage Sorting in Phylogenetic ConflictRecommended by Alan Rogers based on reviews by Richard Durbin and 2 anonymous reviewers
Galtier [1] introduces “Aphid,” a new statistical method that estimates the contributions of gene flow (GF) and incomplete lineage sorting (ILS) to phylogenetic conflict. Aphid is based on the observation that GF tends to make gene genealogies shorter, whereas ILS makes them longer. Rather than fitting the full likelihood, it models the distribution of gene genealogies as a mixture of several canonical gene genealogies in which coalescence times are set equal to their expectations under different models. This simplification makes Aphid far faster than competing methods. In addition, it deals gracefully with bidirectional gene flow—an impossibility under competing models. Because of these advantages, Aphid represents an important addition to the toolkit of evolutionary genetics. In the interest of speed, Aphid makes several simplifying assumptions. Yet even when these were violated, Aphid did well at estimating parameters from simulated data. It seems to be reasonably robust. Aphid studies phylogenetic conflict, which occurs when some loci imply one phylogenetic tree and other loci imply another. This happens when the interval between successive speciation events is fairly short. If this interval is too short, however, Aphid’s approximations break down, and its estimates are biased. Galtier suggests caution when the fraction of discordant phylogenetic trees exceeds 50–55%. Thus, Aphids will be most useful when the interval between speciation events is short, but not too short. Galtier applies the new method to three sets of primate data. In two of these data sets (baboons and African apes), Aphid detects gene flow that would likely be missed by competing methods. These competing methods are primarily sensitive to gene flow that is asymmetric in two senses: (1) greater flow in one direction than the other, and (2) unequal gene flow connecting an outgroup to two sister species. Aphid finds evidence of symmetric gene flow in the ancestry of baboons and also in that of African apes. The data suggest that ancestral humans and chimpanzees both interbred with ancestral gorillas, and at about the same rate. Aphid’s ability to detect this signature sets it apart from competing methods. References [1] Nicolas Galtier (2023) “An approximate likelihood method reveals ancient gene flow between human, chimpanzee and gorilla”. bioRxiv, ver. 3 peer-reviewed and recommended by Peer Community in Mathematical and Computational Biology. https://doi.org/10.1101/2023.07.06.547897 | An approximate likelihood method reveals ancient gene flow between human, chimpanzee and gorilla | Nicolas Galtier | <p>Gene flow and incomplete lineage sorting are two distinct sources of phylogenetic conflict, i.e., gene trees that differ in topology from each other and from the species tree. Distinguishing between the two processes is a key objective of curre... | | Evolutionary Biology, Genetics and population Genetics, Genomics and Transcriptomics | Alan Rogers | 2023-07-06 18:41:16 | ||
18 Apr 2023
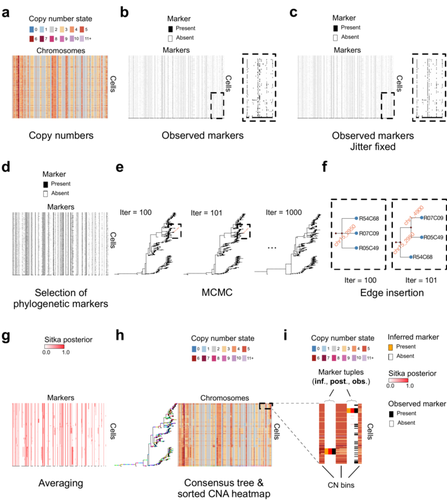
Cancer phylogenetic tree inference at scale from 1000s of single cell genomesPhylogenetic reconstruction from copy number aberration in large scale, low-depth genome-wide single-cell data.Recommended by Amaury Lambert based on reviews by 3 anonymous reviewersThe paper [1] presents and applies a new Bayesian inference method of phylogenetic reconstruction for multiple sequence alignments in the case of low sequencing coverage but diverse copy number aberrations (CNA), with applications to single cell sequencing of tumors. The idea is to take advantage of CNA to reconstruct the topology of the phylogenetic tree of sequenced cells in a first step (the `sitka' method), and in a second step to assign single nucleotide variants (SNV) to tree edges (and then calibrate their lengths) (the `sitka-snv' method). The data are summarized into a binary-valued CxL matrix Y, where C is the number of cells and L is the number of loci (here, loci are segments of prescribed length called `bins'). The entry of Y at row i and column j is 1 (otherwise 0) iff in the ancestral lineage of cell i, at least one genomic rearrangement has occurred, and more specifically the gain or loss of a segment with at least one endpoint in locus j or in locus j+1. The authors expect the infinite-allele assumption to approximately hold (i.e., that at most one mutation occurs at any given marker and that 0 is the ancestral state). They refer to this assumption as the `perfect phylogeny assumption'. By only recording from CNA events the endpoints at which they occur, the authors lose the information on copy number, but they gain the assumption of independence of the mutational processes occurring at different sites, which approximately holds for CNA endpoints. The goal of sitka is to produce a posterior distribution on phylogenetic trees conditional on the matrix Y , where here a phylogenetic tree is understood as containing the information on 1) the topology of the tree but not its edge lengths, and 2) for each edge, the identity of markers having undergone a mutation, in the sense of the previous paragraph. The results of the method are tested against synthetic datasets simulated under various assumptions, including conditions violating the perfect phylogeny assumption and compared to results obtained under other baseline methods. The method is extended to assign SNV to edges of the tree inferred by sitka. It is also applied to real datasets of single cell genomes of tumors. The manuscript is very well-written, with a high degree of detail. The method is novel, scalable, fast and appears to perform favorably compared to other approaches. It has been applied in independent publications, for example to multi-year time-series single-cell whole-genome sequencing of tumors, in order to infer the fitness landscape and its dynamics through time, see [2]. The reviewing process has taken too long, mainly because of other commitments I had during the period and to the difficulty of finding reviewers. Let me apologize to the authors and thank them for their patience as well as for the scientific rigor they brought to their revisions and answers to reviewers, who I also warmly thank for their quality work. REFERENCES [1] Sohrab Salehi, Fatemeh Dorri, Kevin Chern, Farhia Kabeer, Nicole Rusk, Tyler Funnell, Marc J Williams, Daniel Lai, Mirela Andronescu, Kieran R. Campbell, Andrew McPherson, Samuel Aparicio, Andrew Roth, Sohrab Shah, and Alexandre Bouchard-Côté. Cancer phylogenetic tree inference at scale from 1000s of single cell genomes (2023). bioRxiv, 2020.05.06.058180, ver. 4 peer-reviewed and recommended by Peer Community in Mathematical and Computational Biology. [2] Sohrab Salehi, Farhia Kabeer, Nicholas Ceglia, Mirela Andronescu, Marc J. Williams, Kieran R. Campbell, Tehmina Masud, Beixi Wang, Justina Biele, Jazmine Brimhall, David Gee, Hakwoo Lee, Jerome Ting, Allen W. Zhang, Hoa Tran, Ciara O’Flanagan, Fatemeh Dorri, Nicole Rusk, Teresa Ruiz de Algara, So Ra Lee, Brian Yu Chieh Cheng, Peter Eirew, Takako Kono, Jenifer Pham, Diljot Grewal, Daniel Lai, Richard Moore, Andrew J. Mungall, Marco A. Marra, IMAXT Consortium, Andrew McPherson, Alexandre Bouchard-Côté, Samuel Aparicio & Sohrab P. Shah. Clonal fitness inferred from time-series modelling of single-cell cancer genomes (2021). Nature 595, 585–590. https://doi.org/10.1038/s41586-021-03648-3 | Cancer phylogenetic tree inference at scale from 1000s of single cell genomes | Sohrab Salehi, Fatemeh Dorri, Kevin Chern, Farhia Kabeer, Nicole Rusk, Tyler Funnell, Marc J Williams, Daniel Lai, Mirela Andronescu, Kieran R. Campbell, Andrew McPherson, Samuel Aparicio, Andrew Roth, Sohrab Shah, and Alexandre Bouchard-Côté | <p style="text-align: justify;">A new generation of scalable single cell whole genome sequencing (scWGS) methods allows unprecedented high resolution measurement of the evolutionary dynamics of cancer cell populations. Phylogenetic reconstruction ... | | Evolutionary Biology, Genetics and population Genetics, Genomics and Transcriptomics, Machine learning, Probability and statistics | Amaury Lambert | 2021-12-10 17:08:04 |


