
Latest recommendations

| Id | Title * | Authors * | Abstract * ▲ | Picture * | Thematic fields * | Recommender | Reviewers | Submission date | |
|---|---|---|---|---|---|---|---|---|---|
07 Sep 2021
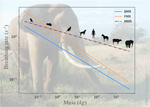
The origin of the allometric scaling of lung ventilation in mammalsHow mammals adapt their breath to body activity – and how this depends on body sizeRecommended by Wolfram Liebermeister based on reviews by Elad Noor, Oliver Ebenhöh, Stefan Schuster and Megumi Inoue based on reviews by Elad Noor, Oliver Ebenhöh, Stefan Schuster and Megumi Inoue
How fast and how deep do animals breathe, and how does this depend on how active they are? To answer this question, one needs to dig deeply into how breathing works and what biophysical processes it involves. And one needs to think about body size. It is impressive how nature adapts the same body plan – e.g. the skeletal structure of mammals – to various shapes and sizes. From mice to whales, also the functioning of most organs remains the same; they are just differently scaled. Scaling does not just mean “making bigger or smaller”. As already noted by Galilei, body shapes change as they are adapted to body dimensions, and the same holds for physiological variables. Many such variables, for instance, heartbeat rates, follow scaling laws of the form y~x^a, where x denotes body mass and the exponent a is typically a multiple of ¼ [1]. These unusual exponents – instead of multiples of ⅓, which would be expected from simple geometrical scaling – are why these laws are called “allometric”. Kleiber’s law for metabolic rates, with a scaling exponent of ¾, is a classic example [2]. As shown by G. West, allometric laws can be explained through a few simple steps [1]. In his models, he focused on network-like organs such as the vascular system and assumed that these systems show a self-similar structure, with a fixed minimal unit (for instance, capillaries) but varying numbers of hierarchy levels depending on body size. To determine the flow through such networks, he employed biophysical models and optimality principles (for instance, assuming that oxygen must be transported at a minimal mechanical effort), and showed that the solutions – and the physiological variables – respect the known scaling relations. The paper “The origin of the allometric scaling of lung ventilation in mammals“ by Noël et al. [3], applies this thinking to the depth and rate of breathing in mammals. Scaling laws describing breathing in resting animals have been known since the 1950s [4], with exponents of 1 (for tidal volume) and -¼ (for breathing frequency). Equipped with a detailed biophysical model, Noël et al. revisit this question, extending these laws to other metabolic regimes. Their starting point is a model of the human lung, developed previously by two of the authors [5], which assumes that we meet our oxygen demand with minimal lung movements. To state this as an optimization problem, the model combines two submodels: a mechanical model describing the energetic effort of ventilation and a highly detailed model of convection and diffusion in self-similar lung geometries. Breathing depths and rates are computed by numerical optimization, and to obtain results for mammals of any size many of the model parameters are described by known scaling laws. As expected, the depth of breathing (measured by tidal volume) scales almost proportionally with body mass and increases with metabolic demand, while the breathing rate decreases with body mass, with an exponent of about -¼. However, the laws for the breathing rate hold only for basal activity; at higher metabolic rates, which are modeled here for the first time, the exponent deviates strongly from this value, in line with empirical data. Why is this paper important? The authors present a highly complex model of lung physiology that integrates a wide range of biophysical details and passes a difficult test: the successful prediction of unexplained scaling exponents. These scaling relations may help us transfer insights from animal models to humans and in reverse: data for breathing during exercise, which are easy to measure in humans, can be extrapolated to other species. Aside from the scaling laws, the model also reveals physiological mechanisms. In the larger lung branches, oxygen is transported mainly by air movement (convection), while in smaller branches air flow is slow and oxygen moves by diffusion. The transition between these regimes can occur at different depths in the lung: as the authors state, “the localization of this transition determines how ventilation should be controlled to minimize its energetic cost at any metabolic regime”. In the model, the optimal location for the transition depends on oxygen demand [5, 6]: the transition occurs deeper in the lung in exercise regimes than at rest, allowing for more oxygen to be taken up. However, the effects of this shift depend on body size: while small mammals generally use the entire exchange surface of their lungs, large mammals keep a reserve for higher activities, which becomes accessible as their transition zone moves at high metabolic rates. Hence, scaling can entail qualitative differences between species! Altogether, the paper shows how the dynamics of ventilation depend on lung morphology. But this may also play out in the other direction: if energy-efficient ventilation depends on body activity, and therefore on ecological niches, a niche may put evolutionary pressures on lung geometry. Hence, by understanding how deep and fast animals breathe, we may also learn about how behavior, physiology, and anatomy co-evolve. References [1] West GB, Brown JH, Enquist BJ (1997) A General Model for the Origin of Allometric Scaling Laws in Biology. Science 276 (5309), 122–126. https://doi.org/10.1126/science.276.5309.122 [2] Kleiber M (1947) Body size and metabolic rate. Physiological Reviews, 27, 511–541. https://doi.org/10.1152/physrev.1947.27.4.511 [3] Noël F., Karamaoun C., Dempsey J. A. and Mauroy B. (2021) The origin of the allometric scaling of lung's ventilation in mammals. arXiv, 2005.12362, ver. 6 peer-reviewed and recommended by Peer community in Mathematical and Computational Biology. https://arxiv.org/abs/2005.12362 [4] Otis AB, Fenn WO, Rahn H (1950) Mechanics of Breathing in Man. Journal of Applied Physiology, 2, 592–607. https://doi.org/10.1152/jappl.1950.2.11.592 [5] Noël F, Mauroy B (2019) Interplay Between Optimal Ventilation and Gas Transport in a Model of the Human Lung. Frontiers in Physiology, 10, 488. https://doi.org/10.3389/fphys.2019.00488 [6] Sapoval B, Filoche M, Weibel ER (2002) Smaller is better—but not too small: A physical scale for the design of the mammalian pulmonary acinus. Proceedings of the National Academy of Sciences, 99, 10411–10416. https://doi.org/10.1073/pnas.122352499 | The origin of the allometric scaling of lung ventilation in mammals | Frédérique Noël, Cyril Karamaoun, Jerome A. Dempsey, Benjamin Mauroy | <p>A model of optimal control of ventilation has recently been developed for humans. This model highlights the importance of the localization of the transition between a convective and a diffusive transport of respiratory gas. This localization de... | | Biophysics, Evolutionary Biology, Physiology | Wolfram Liebermeister | 2020-08-28 15:18:03 | ||
28 Jun 2024
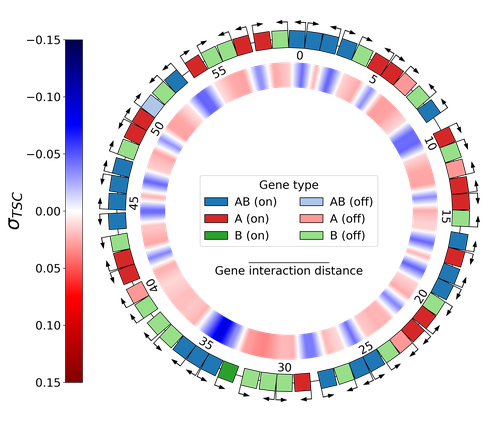
Emergence of Supercoiling-Mediated Regulatory Networks through the Evolution of Bacterial Chromosome OrganizationUnderstanding the impact of the transcription-supercoiling coupling on bacterial genome evolutionRecommended by Nelle Varoquaux based on reviews by Ivan Junier and 1 anonymous reviewer
DNA supercoiling, the under or overwinding of DNA, is known to strongly impact gene expression, as changes in levels of supercoiling directly influence transcription rates. In turn, gene transcription generates DNA supercoiling on each side of an advancing RNA polymerase. This coupling between DNA supercoiling and transcription may result in different outcomes, depending on neighboring gene orientations: divergent genes tend to increase transcription levels, convergent genes tend to inhibit each other, while tandem genes may exhibit more intricate relationships. While several works have investigated the relationship between transcription and supercoiling, Grohens et al [1] address a different question: how does transcription-supercoiling coupling drive genome evolution? To this end, they consider a simple model of gene expression regulation where transcription level only depends on the local DNA supercoiling and where the transcription of one gene generates a linear profile of positive and negative DNA supercoiling on each side of it. They then make genomes evolve through genomic inversions only considering a fitness that reflects the ability of a genome to cope with two distinct environments for which different genes have to be activated or repressed. Using this simple model, the authors illustrate how evolutionary adaptation via genomic inversions can adjust expression levels for enhanced fitness within specific environments, particularly with the emergence of relaxation-activated genes. Investigating the genomic organization of individual genomes revealed that genes are locally organized to leverage the transcription-supercoiling coupling for activation or inhibition, but larger-scale networks of genes are required to strongly inhibit genes (sometimes up to networks of 20 genes). Thus, supercoiling-mediated interactions between genes can implicate more than just local genes. Finally, they construct an "effective interaction graph" between genes by successively simulating gene knock-outs for all of the genes of an individual and observing the effect on the expression level of other genes. They observe a densely connected interaction network, implying that supercoiling-based regulation could evolve concurrently with genome organization in bacterial genomes. References [1] Théotime Grohens, Sam Meyer, Guillaume Beslon (2024) Emergence of Supercoiling-Mediated Regulatory Networks through the Evolution of Bacterial Chromosome Organization. bioRxiv, ver. 4 peer-reviewed and recommended by Peer Community in Mathematical and Computational Biology https://doi.org/10.1101/2022.09.23.509185 | Emergence of Supercoiling-Mediated Regulatory Networks through the Evolution of Bacterial Chromosome Organization | Théotime Grohens, Sam Meyer, Guillaume Beslon | <p>DNA supercoiling -- the level of twisting and writhing of the DNA molecule around itself -- plays a major role in the regulation of gene expression in bacteria by modulating promoter activity. The level of DNA supercoiling is a dynamic property... | | Biophysics, Evolutionary Biology, Systems biology | Nelle Varoquaux | 2023-06-30 10:34:28 | ||
26 Feb 2024
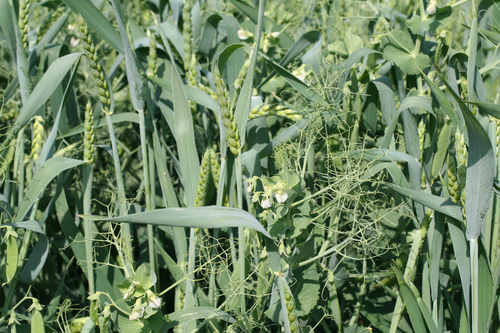
A workflow for processing global datasets: application to intercroppingCollecting, assembling and sharing data in crop sciencesRecommended by Eric Tannier based on reviews by Christine Dillmann and 2 anonymous reviewers
It is often the case that scientific knowledge exists but is scattered across numerous experimental studies. Because of this dispersion in different formats, it remains difficult to access, extract, reproduce, confirm or generalise. This is the case in crop science, where Mahmoud et al [1] propose to collect and assemble data from numerous field experiments on intercropping. It happens that the construction of the global dataset requires a lot of time, attention and a well thought-out method, inspired by the literature on data science [2] and adapted to the specificities of crop science. This activity also leads to new possibilities that were not available in individual datasets, such as the detection of full factorial designs using graph theory tools developed on top of the global dataset. The study by Mahmoud et al [1] has thus multiple dimensions:
I was particularly interested in the promotion of the FAIR principles, perhaps used a little too uncritically in my view, as an obvious solution to data sharing. On the one hand, I am admiring and grateful for the availability of these data, some of which have never been published, nor associated with published results. This approach is likely to unearth buried treasures. On the other hand, I can understand the reluctance of some data producers to commit to total, definitive sharing, facilitating automatic reading, without having thought about a certain reciprocity on the part of users and use by artificial intelligence. Reciprocity in terms of recognition, as is discussed by Mahmoud et al [1], but also in terms of contribution to the commons [5] or reading conditions for machine learning. References [1] Mahmoud R., Casadebaig P., Hilgert N., Gaudio N. A workflow for processing global datasets: application to intercropping. 2024. ⟨hal-04145269v2⟩ ver. 2 peer-reviewed and recommended by Peer Community in Mathematical and Computational Biology. https://hal.science/hal-04145269 [2] Wickham, H. 2014. Tidy data. Journal of Statistical Software 59(10) https://doi.org/10.18637/jss.v059.i10 [3] Gaudio, N., R. Mahmoud, L. Bedoussac, E. Justes, E.-P. Journet, et al. 2023. A global dataset gathering 37 field experiments involving cereal-legume intercrops and their corresponding sole crops. https://doi.org/10.5281/zenodo.8081577 [4] Mahmoud, R., Casadebaig, P., Hilgert, N. et al. Species choice and N fertilization influence yield gains through complementarity and selection effects in cereal-legume intercrops. Agron. Sustain. Dev. 42, 12 (2022). https://doi.org/10.1007/s13593-022-00754-y [5] Bernault, C. « Licences réciproques » et droit d'auteur : l'économie collaborative au service des biens communs ?. Mélanges en l'honneur de François Collart Dutilleul, Dalloz, pp.91-102, 2017, 978-2-247-17057-9. https://shs.hal.science/halshs-01562241 | A workflow for processing global datasets: application to intercropping | Rémi Mahmoud, Pierre Casadebaig, Nadine Hilgert, Noémie Gaudio | <p>Field experiments are a key source of data and knowledge in agricultural research. An emerging practice is to compile the measurements and results of these experiments (rather than the results of publications, as in meta-analysis) into global d... | | Agricultural Science | Eric Tannier | 2023-06-29 15:38:28 | ||
10 Jan 2024
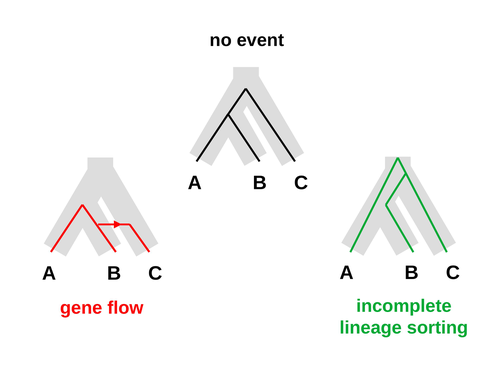
An approximate likelihood method reveals ancient gene flow between human, chimpanzee and gorillaAphid: A Novel Statistical Method for Dissecting Gene Flow and Lineage Sorting in Phylogenetic ConflictRecommended by Alan Rogers based on reviews by Richard Durbin and 2 anonymous reviewers
Galtier [1] introduces “Aphid,” a new statistical method that estimates the contributions of gene flow (GF) and incomplete lineage sorting (ILS) to phylogenetic conflict. Aphid is based on the observation that GF tends to make gene genealogies shorter, whereas ILS makes them longer. Rather than fitting the full likelihood, it models the distribution of gene genealogies as a mixture of several canonical gene genealogies in which coalescence times are set equal to their expectations under different models. This simplification makes Aphid far faster than competing methods. In addition, it deals gracefully with bidirectional gene flow—an impossibility under competing models. Because of these advantages, Aphid represents an important addition to the toolkit of evolutionary genetics. In the interest of speed, Aphid makes several simplifying assumptions. Yet even when these were violated, Aphid did well at estimating parameters from simulated data. It seems to be reasonably robust. Aphid studies phylogenetic conflict, which occurs when some loci imply one phylogenetic tree and other loci imply another. This happens when the interval between successive speciation events is fairly short. If this interval is too short, however, Aphid’s approximations break down, and its estimates are biased. Galtier suggests caution when the fraction of discordant phylogenetic trees exceeds 50–55%. Thus, Aphids will be most useful when the interval between speciation events is short, but not too short. Galtier applies the new method to three sets of primate data. In two of these data sets (baboons and African apes), Aphid detects gene flow that would likely be missed by competing methods. These competing methods are primarily sensitive to gene flow that is asymmetric in two senses: (1) greater flow in one direction than the other, and (2) unequal gene flow connecting an outgroup to two sister species. Aphid finds evidence of symmetric gene flow in the ancestry of baboons and also in that of African apes. The data suggest that ancestral humans and chimpanzees both interbred with ancestral gorillas, and at about the same rate. Aphid’s ability to detect this signature sets it apart from competing methods. References [1] Nicolas Galtier (2023) “An approximate likelihood method reveals ancient gene flow between human, chimpanzee and gorilla”. bioRxiv, ver. 3 peer-reviewed and recommended by Peer Community in Mathematical and Computational Biology. https://doi.org/10.1101/2023.07.06.547897 | An approximate likelihood method reveals ancient gene flow between human, chimpanzee and gorilla | Nicolas Galtier | <p>Gene flow and incomplete lineage sorting are two distinct sources of phylogenetic conflict, i.e., gene trees that differ in topology from each other and from the species tree. Distinguishing between the two processes is a key objective of curre... | | Evolutionary Biology, Genetics and population Genetics, Genomics and Transcriptomics | Alan Rogers | 2023-07-06 18:41:16 | ||
24 Dec 2020
A linear time solution to the Labeled Robinson-Foulds Distance problemComparing reconciled gene trees in linear timeRecommended by Céline Scornavacca based on reviews by Barbara Holland, Gabriel Cardona, Jean-Baka Domelevo Entfellner and 1 anonymous reviewer
Unlike a species tree, a gene tree results not only from speciation events, but also from events acting at the gene level, such as duplications and losses of gene copies, and gene transfer events [1]. The reconciliation of phylogenetic trees consists in embedding a given gene tree into a known species tree and, doing so, determining the location of these gene-level events on the gene tree [2]. Reconciled gene trees can be seen as phylogenetic trees where internal node labels are used to discriminate between different gene-level events. Comparing them is of foremost importance in order to assess the performance of various reconciliation methods (e.g. [3]). References [1] Maddison, W. P. (1997). Gene trees in species trees. Systematic biology, 46(3), 523-536. doi: https://doi.org/10.1093/sysbio/46.3.523 | A linear time solution to the Labeled Robinson-Foulds Distance problem | Samuel Briand, Christophe Dessimoz, Nadia El-Mabrouk and Yannis Nevers | <p>Motivation Comparing trees is a basic task for many purposes, and especially in phylogeny where different tree reconstruction tools may lead to different trees, likely representing contradictory evolutionary information. While a large variety o... | | Combinatorics, Design and analysis of algorithms, Evolutionary Biology | Céline Scornavacca | 2020-08-20 21:06:23 | ||
22 Jul 2024
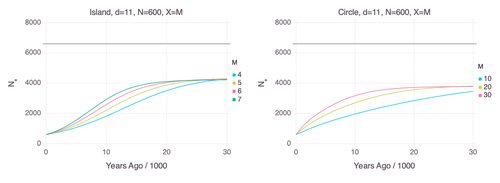
Genetic Evidence for Geographic Structure within the Neanderthal PopulationDecline in Neanderthal effective population size due to geographic structure and gene flowRecommended by Raquel Assis based on reviews by David Bryant and Guillaume AchazPublished PSMC estimates of Neanderthal effective population size (𝑁e) show an approximately five-fold decline over the past 20,000 years [1]. This observation may be attributed to a true decline in Neanderthal 𝑁e, statistical error that is notorious with PSMC estimation, or geographic subdivision and gene flow that has been hypothesized to occur within the Neanderthal population. Determining which of these factors contributes to the observed decline in Neanderthal 𝑁e is an important question that can provide insight into human evolutionary history. Though it is widely believed that the decline in Neanderthal 𝑁e is due to geographic subdivision and gene flow, no prior studies have theoretically examined whether these evolutionary processes can yield the observed pattern. In this paper [2], Rogers tackles this problem by employing two mathematical models to explore the roles of geographic subdivision and gene flow in the Neanderthal population. Results from both models show that geographic subdivision and gene flow can indeed result in a decline in 𝑁e that mirrors the observed decline estimated from empirical data. In contrast, Rogers argues that neither statistical error in PSMC estimates nor a true decline in 𝑁e are expected to produce the consistent decline in estimated 𝑁e observed across three distinct Neanderthal fossils. Statistical error would likely result in variation among these curves, whereas a true decline in 𝑁e would produce shifted curves due to the different ages of the three Neanderthal fossils. In summary, Rogers provides convincing evidence that the most reasonable explanation for the observed decline in Neanderthal 𝑁e is geographic subdivision and gene flow. Rogers also provides a basis for understanding this observation, suggesting that 𝑁e declines over time because coalescence times are shorter between more recent ancestors, as they are more likely to be geographic neighbors. Hence, Rogers’ theoretical findings shed light on an interesting aspect of human evolutionary history. References [1] Fabrizio Mafessoni, Steffi Grote, Cesare de Filippo, Svante Pääbo (2020) “A high-coverage Neandertal genome from Chagyrskaya Cave”. Proceedings of the National Academy of Sciences USA 117: 15132- 15136. https://doi.org/10.1073/pnas.2004944117 [2] Alan Rogers (2024) “Genetic evidence for geographic structure within the Neanderthal population”. bioRxiv, version 4 peer-reviewed and recommended by Peer Community in Mathematical and Computational Biology. https://doi.org/10.1101/2023.07.28.551046 | Genetic Evidence for Geographic Structure within the Neanderthal Population | Alan R. Rogers | <p>PSMC estimates of Neanderthal effective population size (N<sub>e</sub>)exhibit a roughly 5-fold decline across the most recent 20 ky before the death of each fossil. To explain this pattern, this article develops new theory relating... | | Evolutionary Biology, Genetics and population Genetics | Raquel Assis | 2023-10-17 18:06:38 | ||
18 Apr 2023
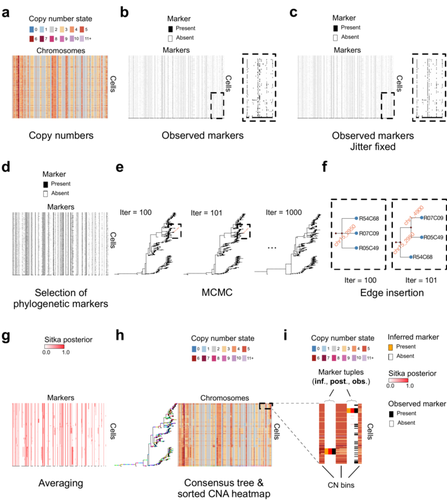
Cancer phylogenetic tree inference at scale from 1000s of single cell genomesPhylogenetic reconstruction from copy number aberration in large scale, low-depth genome-wide single-cell data.Recommended by Amaury Lambert based on reviews by 3 anonymous reviewersThe paper [1] presents and applies a new Bayesian inference method of phylogenetic reconstruction for multiple sequence alignments in the case of low sequencing coverage but diverse copy number aberrations (CNA), with applications to single cell sequencing of tumors. The idea is to take advantage of CNA to reconstruct the topology of the phylogenetic tree of sequenced cells in a first step (the `sitka' method), and in a second step to assign single nucleotide variants (SNV) to tree edges (and then calibrate their lengths) (the `sitka-snv' method). The data are summarized into a binary-valued CxL matrix Y, where C is the number of cells and L is the number of loci (here, loci are segments of prescribed length called `bins'). The entry of Y at row i and column j is 1 (otherwise 0) iff in the ancestral lineage of cell i, at least one genomic rearrangement has occurred, and more specifically the gain or loss of a segment with at least one endpoint in locus j or in locus j+1. The authors expect the infinite-allele assumption to approximately hold (i.e., that at most one mutation occurs at any given marker and that 0 is the ancestral state). They refer to this assumption as the `perfect phylogeny assumption'. By only recording from CNA events the endpoints at which they occur, the authors lose the information on copy number, but they gain the assumption of independence of the mutational processes occurring at different sites, which approximately holds for CNA endpoints. The goal of sitka is to produce a posterior distribution on phylogenetic trees conditional on the matrix Y , where here a phylogenetic tree is understood as containing the information on 1) the topology of the tree but not its edge lengths, and 2) for each edge, the identity of markers having undergone a mutation, in the sense of the previous paragraph. The results of the method are tested against synthetic datasets simulated under various assumptions, including conditions violating the perfect phylogeny assumption and compared to results obtained under other baseline methods. The method is extended to assign SNV to edges of the tree inferred by sitka. It is also applied to real datasets of single cell genomes of tumors. The manuscript is very well-written, with a high degree of detail. The method is novel, scalable, fast and appears to perform favorably compared to other approaches. It has been applied in independent publications, for example to multi-year time-series single-cell whole-genome sequencing of tumors, in order to infer the fitness landscape and its dynamics through time, see [2]. The reviewing process has taken too long, mainly because of other commitments I had during the period and to the difficulty of finding reviewers. Let me apologize to the authors and thank them for their patience as well as for the scientific rigor they brought to their revisions and answers to reviewers, who I also warmly thank for their quality work. REFERENCES [1] Sohrab Salehi, Fatemeh Dorri, Kevin Chern, Farhia Kabeer, Nicole Rusk, Tyler Funnell, Marc J Williams, Daniel Lai, Mirela Andronescu, Kieran R. Campbell, Andrew McPherson, Samuel Aparicio, Andrew Roth, Sohrab Shah, and Alexandre Bouchard-Côté. Cancer phylogenetic tree inference at scale from 1000s of single cell genomes (2023). bioRxiv, 2020.05.06.058180, ver. 4 peer-reviewed and recommended by Peer Community in Mathematical and Computational Biology. [2] Sohrab Salehi, Farhia Kabeer, Nicholas Ceglia, Mirela Andronescu, Marc J. Williams, Kieran R. Campbell, Tehmina Masud, Beixi Wang, Justina Biele, Jazmine Brimhall, David Gee, Hakwoo Lee, Jerome Ting, Allen W. Zhang, Hoa Tran, Ciara O’Flanagan, Fatemeh Dorri, Nicole Rusk, Teresa Ruiz de Algara, So Ra Lee, Brian Yu Chieh Cheng, Peter Eirew, Takako Kono, Jenifer Pham, Diljot Grewal, Daniel Lai, Richard Moore, Andrew J. Mungall, Marco A. Marra, IMAXT Consortium, Andrew McPherson, Alexandre Bouchard-Côté, Samuel Aparicio & Sohrab P. Shah. Clonal fitness inferred from time-series modelling of single-cell cancer genomes (2021). Nature 595, 585–590. https://doi.org/10.1038/s41586-021-03648-3 | Cancer phylogenetic tree inference at scale from 1000s of single cell genomes | Sohrab Salehi, Fatemeh Dorri, Kevin Chern, Farhia Kabeer, Nicole Rusk, Tyler Funnell, Marc J Williams, Daniel Lai, Mirela Andronescu, Kieran R. Campbell, Andrew McPherson, Samuel Aparicio, Andrew Roth, Sohrab Shah, and Alexandre Bouchard-Côté | <p style="text-align: justify;">A new generation of scalable single cell whole genome sequencing (scWGS) methods allows unprecedented high resolution measurement of the evolutionary dynamics of cancer cell populations. Phylogenetic reconstruction ... | | Evolutionary Biology, Genetics and population Genetics, Genomics and Transcriptomics, Machine learning, Probability and statistics | Amaury Lambert | 2021-12-10 17:08:04 | ||
13 Dec 2021
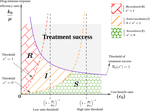
Within-host evolutionary dynamics of antimicrobial quantitative resistanceModelling within-host evolutionary dynamics of antimicrobial resistanceRecommended by Krasimira Tsaneva based on reviews by 2 anonymous reviewersAntimicrobial resistance (AMR) arises due to two main reasons: pathogens are either intrinsically resistant to the antimicrobials, or they can develop new resistance mechanisms in a continuous fashion over time and space. The latter has been referred to as within-host evolution of antimicrobial resistance and studied in infectious disease settings such as Tuberculosis [1]. During antibiotic treatment for example within-host evolutionary AMR dynamics plays an important role [2] and presents significant challenges in terms of optimizing treatment dosage. The study by Djidjou-Demasse et al. [3] contributes to addressing such challenges by developing a modelling approach that utilizes integro-differential equations to mathematically capture continuity in the space of the bacterial resistance levels. Given its importance as a major public health concern with enormous societal consequences around the world, the evolution of drug resistance in the context of various pathogens has been extensively studied using population genetics approaches [4]. This problem has been also addressed using mathematical modelling approaches including Ordinary Differential Equations (ODE)-based [5. 6] and more recently Stochastic Differential Equations (SDE)-based models [7]. In [3] the authors propose a model of within-host AMR evolution in the absence and presence of drug treatment. The advantage of the proposed modelling approach is that it allows for AMR to be represented as a continuous quantitative trait, describing the level of resistance of the bacterial population termed quantitative AMR (qAMR) in [3]. Moreover, consistent with recent experimental evidence [2] integro-differential equations take into account both, the dynamics of the bacterial population density, referred to as “bottleneck size” in [2] as well as the evolution of its level of resistance due to drug-induced selection. The model proposed in [3] has been extensively and rigorously analysed to address various scenarios including the significance of host immune response in drug efficiency, treatment failure and preventive strategies. The drug treatment chosen to be investigated in this study, namely chemotherapy, has been characterised in terms of the level of evolved resistance by the bacterial population in presence of antimicrobial pressure at equilibrium. Furthermore, the minimal duration of drug administration on bacterial growth and the emergence of AMR has been probed in the model by changing the initial population size and average resistance levels. A potential limitation of the proposed model is the assumption that mutations occur frequently (i.e. during growth), which may not be necessarily the case in certain experimental and/or clinical situations. References [1] Castro RAD, Borrell S, Gagneux S (2021) The within-host evolution of antimicrobial resistance in Mycobacterium tuberculosis. FEMS Microbiology Reviews, 45, fuaa071. https://doi.org/10.1093/femsre/fuaa071 [2] Mahrt N, Tietze A, Künzel S, Franzenburg S, Barbosa C, Jansen G, Schulenburg H (2021) Bottleneck size and selection level reproducibly impact evolution of antibiotic resistance. Nature Ecology & Evolution, 5, 1233–1242. https://doi.org/10.1038/s41559-021-01511-2 [3] Djidjou-Demasse R, Sofonea MT, Choisy M, Alizon S (2021) Within-host evolutionary dynamics of antimicrobial quantitative resistance. HAL, hal-03194023, ver. 4 peer-reviewed and recommended by Peer Community in Mathematical and Computational Biology. https://hal.archives-ouvertes.fr/hal-03194023 [4] Wilson BA, Garud NR, Feder AF, Assaf ZJ, Pennings PS (2016) The population genetics of drug resistance evolution in natural populations of viral, bacterial and eukaryotic pathogens. Molecular Ecology, 25, 42–66. https://doi.org/10.1111/mec.13474 [5] Blanquart F, Lehtinen S, Lipsitch M, Fraser C (2018) The evolution of antibiotic resistance in a structured host population. Journal of The Royal Society Interface, 15, 20180040. https://doi.org/10.1098/rsif.2018.0040 [6] Jacopin E, Lehtinen S, Débarre F, Blanquart F (2020) Factors favouring the evolution of multidrug resistance in bacteria. Journal of The Royal Society Interface, 17, 20200105. https://doi.org/10.1098/rsif.2020.0105 [7] Igler C, Rolff J, Regoes R (2021) Multi-step vs. single-step resistance evolution under different drugs, pharmacokinetics, and treatment regimens (BS Cooper, PJ Wittkopp, Eds,). eLife, 10, e64116. https://doi.org/10.7554/eLife.64116 | Within-host evolutionary dynamics of antimicrobial quantitative resistance | Ramsès Djidjou-Demasse, Mircea T. Sofonea, Marc Choisy, Samuel Alizon | <p style="text-align: justify;">Antimicrobial efficacy is traditionally described by a single value, the minimal inhibitory concentration (MIC), which is the lowest concentration that prevents visible growth of the bacterial population. As a conse... | | Dynamical systems, Epidemiology, Evolutionary Biology, Medical Sciences | Krasimira Tsaneva | 2021-04-16 16:55:19 | ||
14 Mar 2023
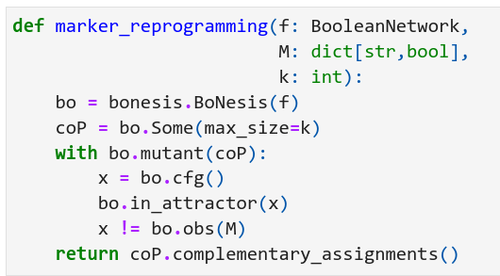
Marker and source-marker reprogramming of Most Permissive Boolean networks and ensembles with BoNesisReprogramming of locally-monotone Boolean networks with BoNesisRecommended by Sergiu Ivanov based on reviews by Ismail Belgacem and 1 anonymous reviewerReprogramming of cellular networks is a well known challenge in computational biology consisting first of all in properly representing an ensemble of networks having a role in a phenomenon of interest, and secondly in designing strategies to alter the functioning of this ensemble in the desired direction. Important applications involve disease study: a therapy can be seen as a reprogramming strategy, and the disease itself can be considered a result of a series of adversarial reprogramming actions. The origins of this domain go back to the seminal paper by Barabási et al. [1] which formalized the concept of network medicine. An abstract tool which has gathered considerable success in network medicine and network biology are Boolean networks: sets of Boolean variables, each equipped with a Boolean update function describing how to compute the next value of the variable from the values of the other variables. Despite apparent dissimilarity with the biological systems which involve varying quantities and continuous processes, Boolean networks have been very effective in representing biological networks whose entities are typically seen as being on or off. Particular examples are protein signalling networks as well as gene regulatory networks. The paper [2] by Loïc Paulevé presents a versatile tool for tackling reprogramming of Boolean networks seen as models of biological networks. The problem of reprogramming is often formulated as the problem of finding a set of perturbations which guarantee some properties on the attractors. The work [2] relies on the most permissive semantics [3], which together with the modelling assumption allows for considerable speed-up in the practically relevant subclass of locally-monotone Boolean networks. The paper is structured as a tutorial. It starts by introducing the formalism, defining 4 different general variants of reprogramming under the most permissive semantics, and presenting evaluations of their complexity in terms of the polynomial hierarchy. The author then describes the software tool BoNesis which can handle different problems related to Boolean networks, and in particular the 4 reprogramming variants. The presentation includes concrete code examples with their output, which should be very helpful for future users. The paper [2] introduces a novel scenario: reprogramming of ensembles of Boolean networks delineated by some properties, including for example the property of having a given interaction graph. Ensemble reprogramming looks particularly promising in situations in which the biological knowledge is insufficient to fully determine all the update functions, i.e. in the majority of modelling situations. Finally, the author also shows how BoNesis can be used to deal with sequential reprogramming, which is another promising direction in computational controllability, potentially enabling more efficient therapies [4,5]. REFERENCES
| Marker and source-marker reprogramming of Most Permissive Boolean networks and ensembles with BoNesis | Loïc Paulevé | <p style="text-align: justify;">Boolean networks (BNs) are discrete dynamical systems with applications to the modeling of cellular behaviors. In this paper, we demonstrate how the software BoNesis can be employed to exhaustively identify combinat... | | Combinatorics, Computational complexity, Dynamical systems, Molecular Biology, Systems biology | Sergiu Ivanov | Ismail Belgacem, Anonymous | 2022-08-31 15:00:21 | |
09 Nov 2023
A mechanistic-statistical approach to infer dispersal and demography from invasion dynamics, applied to a plant pathogenA mechanistic-statistical approach for the field-based study of invasion dynamicsRecommended by Hirohisa Kishino based on reviews by 2 anonymous reviewers
To study the annual invasion of a tree pathogen (Melampsora larici-populina, a fungal species responsible for the poplar rust disease), Xhaard et al (2012) had conducted a spatiotemporal survey along the Durance River valley in the French Alps over nearly 200 km, measuring sampled leaves and twigs from 40 to 150 trees at 12 evenly spaced study sites at seven-time points. By combining Bayesian genetic assignment and a landscape epidemiology approach, they were able to estimate the genetic origin and annual spread of the plant pathogen during a single epidemic. The observed temporal variation in the spatial pattern of infection rates allowed Saubin et al (2023) to estimate the key factors that determine the speed of the invasion dynamics. In particular, it is crucial to estimate the probability and extent of long-distance dispersal. The dynamics of the macroscale population density was formulated by the reaction-diffusion (R.D.) model and by the integro-difference (I.D.) model. Both consist of the diffusion/dispersal component and the reaction component. In the I.D. model, the kernel function represents the distribution of the dispersion. The likelihood function was obtained by coupling the mathematical model of the population dynamics and the statistical model of the observational process. Saubin et al (2023) considered a thin-tailed Gaussian kernel, a heavy-tailed exponential kernel, and a fat-tailed exponential power kernel. The numerical simulation reflecting the above survey confirmed the identifiability of the propagation kernel and the accuracy of the parameter estimation. In particular, the above survey had the high power to identify the model with frequent long-distance dispersal. The data from the survey selected the exponential power kernel with confidence. The mean dispersal distance was estimated to be 2.01 km. The exponential power was 0.24. This parameter value predicts that 5% of the dispersals will have a distance > 14.3 km and 1% will have a distance > 36.0 km. The mechanistic-statistical approach presented here may become a new standard for the field-based studies of invasion dynamics. References Saubin, M., Coville, J., Xhaard, C., Frey, P., Soubeyrand, S., Halkett, F., and Fabre, F. (2023). A mechanistic-statistical approach to infer dispersal and demography from invasion dynamics, applied to a plant pathogen. bioRxiv, ver. 5 peer-reviewed and recommended by Peer Community in Mathematical and Computational Biology. https://doi.org/10.1101/2023.03.21.533642 Xhaard, C., Barrès, B., Andrieux, A., Bousset, L., Halkett, F., and Frey, P. (2012). Disentangling the genetic origins of a plant pathogen during disease spread using an original molecular epidemiology approach. Molecular Ecology, 21(10):2383-2398. https://doi.org/10.1111/j.1365-294X.2012.05556.x | A mechanistic-statistical approach to infer dispersal and demography from invasion dynamics, applied to a plant pathogen | Méline Saubin, Jérome Coville, Constance Xhaard, Pascal Frey, Samuel Soubeyrand, Fabien Halkett, Frédéric Fabre | <p style="text-align: justify;">Dispersal, and in particular the frequency of long-distance dispersal (LDD) events, has strong implications for population dynamics with possibly the acceleration of the colonisation front, and for evolution with po... | | Dynamical systems, Ecology, Epidemiology, Probability and statistics | Hirohisa Kishino | 2023-05-10 09:57:25 |


