
Latest recommendations

| Id | Title * | Authors * ▲ | Abstract * | Picture * | Thematic fields * | Recommender | Reviewers | Submission date | |
|---|---|---|---|---|---|---|---|---|---|
26 May 2021
An efficient algorithm for estimating population history from genetic dataAn efficient implementation of legofit software to infer demographic histories from population genetic dataRecommended by Matteo Fumagalli based on reviews by Fernando Racimo and 1 anonymous reviewer based on reviews by Fernando Racimo and 1 anonymous reviewer
The estimation of demographic parameters from population genetic data has been the subject of many scientific studies [1]. Among these efforts, legofit was firstly proposed in 2019 as a tool to infer size changes, subdivision and gene flow events from patterns of nucleotidic variation [2]. The first release of legofit used a stochastic algorithm to fit population parameters to the observed data. As it requires simulations to evaluate the fitting of each model, it is computationally intensive and can only be deployed on high-performance computing clusters. To overcome this issue, Rogers proposes a new implementation of legofit based on a deterministic algorithm that allows the estimation of demographic histories to be computationally faster and more accurate [3]. The new algorithm employs a continuous-time Markov chain that traces the ancestry of each sample into the past. The calculations are now divided into two steps, the first one being solved numerically. To test the hypothesis that the new implementation of legofit produces a more desirable performance, Rogers generated extensive simulations of genomes from African, European, Neanderthal and Denisovan populations with msprime [4]. Additionally, legofit was tested on real genetic data from samples of said populations, following a previously published study [5]. Based on simulations, the new deterministic algorithm is more than 1600 times faster than the previous stochastic model. Notably, the new version of legofit produces smaller residual errors, although the overall accuracy to estimate population parameters is comparable to the one obtained using the stochastic algorithm. When applied to real data, the new implementation of legofit was able to recapitulate previous findings of a complex demographic model with early gene flow from humans to Neanderthal [5]. Notably, the new implementation generates better discrimination between models, therefore leading to a better precision at predicting the population history. Some parameters estimated from real data point towards unrealistic scenarios, suggesting that the initial model could be misspecified. Further research is needed to fully explore the parameter range that can be evaluated by legofit, and to clarify the source of any associated bias. Additionally, the inclusion of data uncertainty in parameter estimation and model selection may be required to apply legofit to low-coverage high-throughput sequencing data [6]. Nevertheless, legofit is an efficient, accessible and user-friendly software to infer demographic parameters from genetic data and can be widely applied to test hypotheses in evolutionary biology. The new implementation of legofit software is freely available at https://github.com/alanrogers/legofit. References [1] Spence JP, Steinrücken M, Terhorst J, Song YS (2018) Inference of population history using coalescent HMMs: review and outlook. Current Opinion in Genetics & Development, 53, 70–76. https://doi.org/10.1016/j.gde.2018.07.002 [2] Rogers AR (2019) Legofit: estimating population history from genetic data. BMC Bioinformatics, 20, 526. https://doi.org/10.1186/s12859-019-3154-1 [3] Rogers AR (2021) An Efficient Algorithm for Estimating Population History from Genetic Data. bioRxiv, 2021.01.23.427922, ver. 5 peer-reviewed and recommended by Peer community in Mathematical and Computational Biology. https://doi.org/10.1101/2021.01.23.427922 [4] Kelleher J, Etheridge AM, McVean G (2016) Efficient Coalescent Simulation and Genealogical Analysis for Large Sample Sizes. PLOS Computational Biology, 12, e1004842. https://doi.org/10.1371/journal.pcbi.1004842 [5] Rogers AR, Harris NS, Achenbach AA (2020) Neanderthal-Denisovan ancestors interbred with a distantly related hominin. Science Advances, 6, eaay5483. https://doi.org/10.1126/sciadv.aay5483 [6] Soraggi S, Wiuf C, Albrechtsen A (2018) Powerful Inference with the D-Statistic on Low-Coverage Whole-Genome Data. G3 Genes|Genomes|Genetics, 8, 551–566. https://doi.org/10.1534/g3.117.300192 | An efficient algorithm for estimating population history from genetic data | Alan R. Rogers | <p style="text-align: justify;">The Legofit statistical package uses genetic data to estimate parameters describing population history. Previous versions used computer simulations to estimate probabilities, an approach that limited both speed and ... | | Combinatorics, Genetics and population Genetics | Matteo Fumagalli | 2021-01-26 20:04:35 | ||
22 Jul 2024
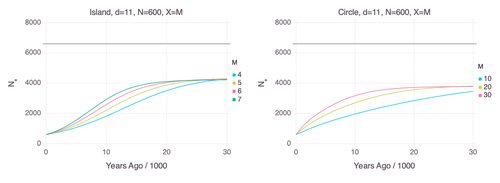
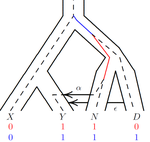
Genetic Evidence for Geographic Structure within the Neanderthal PopulationDecline in Neanderthal effective population size due to geographic structure and gene flowRecommended by Raquel Assis based on reviews by David Bryant and Guillaume AchazPublished PSMC estimates of Neanderthal effective population size (𝑁e) show an approximately five-fold decline over the past 20,000 years [1]. This observation may be attributed to a true decline in Neanderthal 𝑁e, statistical error that is notorious with PSMC estimation, or geographic subdivision and gene flow that has been hypothesized to occur within the Neanderthal population. Determining which of these factors contributes to the observed decline in Neanderthal 𝑁e is an important question that can provide insight into human evolutionary history. Though it is widely believed that the decline in Neanderthal 𝑁e is due to geographic subdivision and gene flow, no prior studies have theoretically examined whether these evolutionary processes can yield the observed pattern. In this paper [2], Rogers tackles this problem by employing two mathematical models to explore the roles of geographic subdivision and gene flow in the Neanderthal population. Results from both models show that geographic subdivision and gene flow can indeed result in a decline in 𝑁e that mirrors the observed decline estimated from empirical data. In contrast, Rogers argues that neither statistical error in PSMC estimates nor a true decline in 𝑁e are expected to produce the consistent decline in estimated 𝑁e observed across three distinct Neanderthal fossils. Statistical error would likely result in variation among these curves, whereas a true decline in 𝑁e would produce shifted curves due to the different ages of the three Neanderthal fossils. In summary, Rogers provides convincing evidence that the most reasonable explanation for the observed decline in Neanderthal 𝑁e is geographic subdivision and gene flow. Rogers also provides a basis for understanding this observation, suggesting that 𝑁e declines over time because coalescence times are shorter between more recent ancestors, as they are more likely to be geographic neighbors. Hence, Rogers’ theoretical findings shed light on an interesting aspect of human evolutionary history. References [1] Fabrizio Mafessoni, Steffi Grote, Cesare de Filippo, Svante Pääbo (2020) “A high-coverage Neandertal genome from Chagyrskaya Cave”. Proceedings of the National Academy of Sciences USA 117: 15132- 15136. https://doi.org/10.1073/pnas.2004944117 [2] Alan Rogers (2024) “Genetic evidence for geographic structure within the Neanderthal population”. bioRxiv, version 4 peer-reviewed and recommended by Peer Community in Mathematical and Computational Biology. https://doi.org/10.1101/2023.07.28.551046 | Genetic Evidence for Geographic Structure within the Neanderthal Population | Alan R. Rogers | <p>PSMC estimates of Neanderthal effective population size (N<sub>e</sub>)exhibit a roughly 5-fold decline across the most recent 20 ky before the death of each fossil. To explain this pattern, this article develops new theory relating... | | Evolutionary Biology, Genetics and population Genetics | Raquel Assis | 2023-10-17 18:06:38 | ||
04 Feb 2022
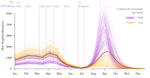
Non-Markovian modelling highlights the importance of age structure on Covid-19 epidemiological dynamicsImportance of age structure on modeling COVID-19 epidemiological dynamicsRecommended by Chen Liao based on reviews by Facundo Muñoz, Kevin Bonham and 1 anonymous reviewerCOVID-19 spread around the globe in early 2020 and has deeply changed our everyday life [1]. Mathematical models allow us to estimate R0 (basic reproduction number), understand the progression of viral infection, explore the impacts of quarantine on the epidemic, and most importantly, predict the future outbreak [2]. The most classical model is SIR, which describes time evolution of three variables, i.e., number of susceptible people (S), number of people infected (I), and number of people who have recovered (R), based on their transition rates [3]. Despite the simplicity, SIR model produces several general predictions that have important implications for public health [3]. SIR model includes three populations with distinct labels and is thus compartmentalized. Extra compartments can be added to describe additional states of populations, for example, people exposed to the virus but not yet infectious. However, a model with more compartments, though more realistic, is also more difficult to parameterize and analyze. The study by Reyné et al. [4] proposed an alternative formalism based on PDE (partial differential equation), which allows modeling different biological scenarios without the need of adding additional compartments. As illustrated, the authors modeled hospital admission dynamics in a vaccinated population only with 8 general compartments. The main conclusion of this study is that the vaccination level till 2021 summer was insufficient to prevent a new epidemic in France. Additionally, the authors used alternative data sources to estimate the age-structured contact patterns. By sensitivity analysis on a daily basis, they found that the 9 parameters in the age-structured contact matrix are most variable and thus shape Covid19 pandemic dynamics. This result highlights the importance of incorporating age structure of the host population in modeling infectious diseases. However, a relevant potential limitation is that the contact matrix was assumed to be constant throughout the simulations. To account for time dependence of the contact matrix, social and behavioral factors need to be integrated [5]. References [1] Hu B, Guo H, Zhou P, Shi Z-L (2021) Characteristics of SARS-CoV-2 and COVID-19. Nature Reviews Microbiology, 19, 141–154. https://doi.org/10.1038/s41579-020-00459-7 [2] Jinxing G, Yongyue W, Yang Z, Feng C (2020) Modeling the transmission dynamics of COVID-19 epidemic: a systematic review. The Journal of Biomedical Research, 34, 422–430. https://doi.org/10.7555/JBR.34.20200119 [3] Tolles J, Luong T (2020) Modeling Epidemics With Compartmental Models. JAMA, 323, 2515–2516. https://doi.org/10.1001/jama.2020.8420 [4] Reyné B, Richard Q, Noûs C, Selinger C, Sofonea MT, Djidjou-Demasse R, Alizon S (2022) Non-Markovian modelling highlights the importance of age structure on Covid-19 epidemiological dynamics. medRxiv, 2021.09.30.21264339, ver. 3 peer-reviewed and recommended by Peer Community in Mathematical and Computational Biology. https://doi.org/10.1101/2021.09.30.21264339 [5] Bedson J, Skrip LA, Pedi D, Abramowitz S, Carter S, Jalloh MF, Funk S, Gobat N, Giles-Vernick T, Chowell G, de Almeida JR, Elessawi R, Scarpino SV, Hammond RA, Briand S, Epstein JM, Hébert-Dufresne L, Althouse BM (2021) A review and agenda for integrated disease models including social and behavioural factors. Nature Human Behaviour, 5, 834–846 https://doi.org/10.1038/s41562-021-01136-2 | Non-Markovian modelling highlights the importance of age structure on Covid-19 epidemiological dynamics | Bastien Reyné, Quentin Richard, Camille Noûs, Christian Selinger, Mircea T. Sofonea, Ramsès Djidjou-Demasse, Samuel Alizon | <p style="text-align: justify;">The Covid-19 pandemic outbreak was followed by a huge amount of modelling studies in order to rapidly gain insights to implement the best public health policies. Most of these compartmental models involved ordinary ... | | Dynamical systems, Epidemiology, Systems biology | Chen Liao | 2021-10-04 13:49:51 | ||
23 Jul 2024
Alignment-free detection and seed-based identification of multi-loci V(D)J recombinations in Vidjil-algoAn accelerated Vidjil algorithm: up to 30X faster identification of V(D)J recombinations via spaced seeds and Aho-Corasick pattern matchingRecommended by Giulio Ermanno Pibiri based on reviews by Sven Rahmann and 1 anonymous reviewer
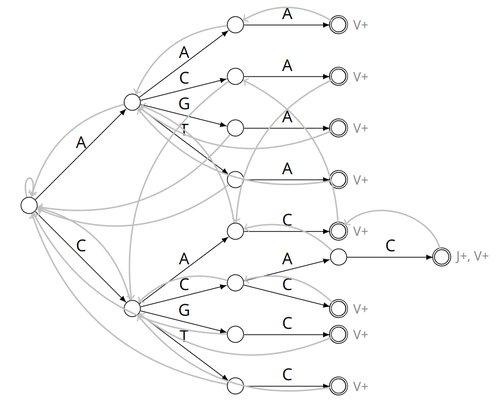
VDJ recombination is a crucial process in the immune system, where a V (variable) gene, a D (diversity) gene, and a J (joining) gene are randomly combined to create unique antigen receptor genes. This process generates a vast diversity of antibodies and T-cell receptors, essential for recognizing and combating a wide array of pathogens. By identifying and quantifying these VDJ recombinations, we can gain a deeper and more precise understanding of the immune response, enhancing our ability to monitor and manage immune-related conditions. It is therefore important to develop efficient methods to identify and extract VDJ recombinations from large sequences (e.g., several millions/billions of nucleotides). The work by Borée, Giraud, and Salson [2] contributes one such algorithm. As in previous work, the proposed algorithm employs the Aho-Corasick automaton to simultaneously match several patterns against a string but, differently from other methods, it also combines the efficiency of spaced seeds. Working with seeds rather than the original string has the net benefit of speeding up the algorithm and reducing its memory usage, sometimes at the price of a modest loss in accuracy. Experiments conducted on five different datasets demonstrate that these features grant the proposed method excellent practical performance compared to the best previous methods, like Vidjil [3] (up to 5X faster) and MiXCR [1] (up to 30X faster), with no quality loss. The method can also be considered an excellent example of a more general trend in scalable algorithmic design: adapt "classic" algorithms (in this case, the Aho-Corasick pattern matching algorithm) to work in sketch space (e.g., the spaced seeds used here), trading accuracy for efficiency. Sometimes, this compromise is necessary for the sake of scaling to very large datasets using modest computing power. References [1] D. A. Bolotin, S. Poslavsky, I. Mitrophanov, M. Shugay, I. Z. Mamedov, E. V. Putintseva, and D. M. Chudakov (2015). "MiXCR: software for comprehensive adaptive immunity profiling." Nature Methods 12, 380–381. ISSN: 1548-7091. https://doi.org/10.1038/nmeth.3364 [2] C. Borée, M. Giraud, M. Salson (2024) "Alignment-free detection and seed-based identification of multi-loci V(D)J recombinations in Vidjil-algo". https://hal.science/hal-04361907v2, version 2, peer-reviewed and recommended by Peer Community In Mathematical and Computational Biology. [3] M. Giraud, M. Salson, M. Duez, C. Villenet, S. Quief, A. Caillault, N. Grardel, C. Roumier, C. Preudhomme, and M. Figeac (2014). "Fast multiclonal clusterization of V(D)J recombinations from high-throughput sequencing". BMC Genomics 15, 409. https://doi.org/10.1186/1471-2164-15-409. | Alignment-free detection and seed-based identification of multi-loci V(D)J recombinations in Vidjil-algo | Cyprien Borée, Mathieu Giraud, Mikaël Salson | <p>The diversity of the immune repertoire is grounded on V(D)J recombinations in several loci. Many algorithms and software detect and designate these recombinations in high-throughput sequencing data. To improve their efficiency, we propose a mul... | | Combinatorics, Computational complexity, Design and analysis of algorithms, Genomics and Transcriptomics, Immunology | Giulio Ermanno Pibiri | 2023-12-28 18:03:42 | ||
07 Dec 2021
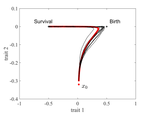
The emergence of a birth-dependent mutation rate in asexuals: causes and consequencesA new perspective in modeling mutation rate for phenotypically structured populationsRecommended by Yuan Lou based on reviews by Hirohisa Kishino and 1 anonymous reviewerIn standard mutation-selection models for describing the dynamics of phenotypically structured populations, it is often assumed that the mutation rate is constant across the phenotypes. In particular, this assumption leads to a constant diffusion coefficient for diffusion approximation models (Perthame, 2007 and references therein). Patout et al (2021) study the dependence of the mutation rate on the birth rate, by introducing some diffusion approximations at the population level, derived from the large population limit of a stochastic, individual-based model. The reaction-diffusion model in this article is of the “cross-diffusion” type: The form of “cross-diffusion” also appeared in ecological literature as a type of biased movement behaviors for organisms (Shigesada et al., 1979). The key underlying assumption for “cross-diffusion” is that the transition probability at the individual level depends solely upon the condition at the departure point. Patout et al (2021) envision that a higher birth rate yields more mutations per unit of time. One of their motivations is that during cancer development, the mutation rates of cancer cells at the population level could be correlated with reproduction success. The reaction-diffusion approximation model derived in this article illustrates several interesting phenomena: For the time evolution situation, their model predicts different solution trajectories under various assumptions on the fitness function, e.g. the trajectory could initially move towards the birth optimum but eventually end up at the survival optimum. Their model also predicts that the mean fitness could be flat for some period of time, which might provide another alternative to explain observed data. At the steady-state level, their model suggests that the populations are more concentrated around the survival optimum, which agrees with the evolution of the time-dependent solution trajectories. Perhaps one of the most interesting contributions of the study of Patout et al (2021) is to give us a new perspective to model the mutation rate in phenotypically structured populations and subsequently, and to help us better understand the connection between mutation and selection. More broadly, this article offers some new insights into the evolutionary dynamics of phenotypically structured populations, along with potential implications in empirical studies. References Perthame B (2007) Transport Equations in Biology Frontiers in Mathematics. Birkhäuser, Basel. https://doi.org/10.1007/978-3-7643-7842-4_2 Patout F, Forien R, Alfaro M, Papaïx J, Roques L (2021) The emergence of a birth-dependent mutation rate in asexuals: causes and consequences. bioRxiv, 2021.06.11.448026, ver. 3 peer-reviewed and recommended by Peer Community in Mathematical and Computational Biology. https://doi.org/10.1101/2021.06.11.448026 Shigesada N, Kawasaki K, Teramoto E (1979) Spatial segregation of interacting species. Journal of Theoretical Biology, 79, 83–99. https://doi.org/10.1016/0022-5193(79)90258-3 | The emergence of a birth-dependent mutation rate in asexuals: causes and consequences | Florian Patout, Raphaël Forien, Matthieu Alfaro, Julien Papaïx, Lionel Roques | <p style="text-align: justify;">In unicellular organisms such as bacteria and in most viruses, mutations mainly occur during reproduction. Thus, genotypes with a high birth rate should have a higher mutation rate. However, standard models of asexu... | | Dynamical systems, Evolutionary Biology, Probability and statistics, Stochastic dynamics | Yuan Lou | Anonymous, Hirohisa Kishino | 2021-06-12 13:59:45 | |
07 Sep 2021
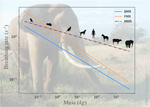
The origin of the allometric scaling of lung ventilation in mammalsHow mammals adapt their breath to body activity – and how this depends on body sizeRecommended by Wolfram Liebermeister based on reviews by Elad Noor, Oliver Ebenhöh, Stefan Schuster and Megumi Inoue
How fast and how deep do animals breathe, and how does this depend on how active they are? To answer this question, one needs to dig deeply into how breathing works and what biophysical processes it involves. And one needs to think about body size. It is impressive how nature adapts the same body plan – e.g. the skeletal structure of mammals – to various shapes and sizes. From mice to whales, also the functioning of most organs remains the same; they are just differently scaled. Scaling does not just mean “making bigger or smaller”. As already noted by Galilei, body shapes change as they are adapted to body dimensions, and the same holds for physiological variables. Many such variables, for instance, heartbeat rates, follow scaling laws of the form y~x^a, where x denotes body mass and the exponent a is typically a multiple of ¼ [1]. These unusual exponents – instead of multiples of ⅓, which would be expected from simple geometrical scaling – are why these laws are called “allometric”. Kleiber’s law for metabolic rates, with a scaling exponent of ¾, is a classic example [2]. As shown by G. West, allometric laws can be explained through a few simple steps [1]. In his models, he focused on network-like organs such as the vascular system and assumed that these systems show a self-similar structure, with a fixed minimal unit (for instance, capillaries) but varying numbers of hierarchy levels depending on body size. To determine the flow through such networks, he employed biophysical models and optimality principles (for instance, assuming that oxygen must be transported at a minimal mechanical effort), and showed that the solutions – and the physiological variables – respect the known scaling relations. The paper “The origin of the allometric scaling of lung ventilation in mammals“ by Noël et al. [3], applies this thinking to the depth and rate of breathing in mammals. Scaling laws describing breathing in resting animals have been known since the 1950s [4], with exponents of 1 (for tidal volume) and -¼ (for breathing frequency). Equipped with a detailed biophysical model, Noël et al. revisit this question, extending these laws to other metabolic regimes. Their starting point is a model of the human lung, developed previously by two of the authors [5], which assumes that we meet our oxygen demand with minimal lung movements. To state this as an optimization problem, the model combines two submodels: a mechanical model describing the energetic effort of ventilation and a highly detailed model of convection and diffusion in self-similar lung geometries. Breathing depths and rates are computed by numerical optimization, and to obtain results for mammals of any size many of the model parameters are described by known scaling laws. As expected, the depth of breathing (measured by tidal volume) scales almost proportionally with body mass and increases with metabolic demand, while the breathing rate decreases with body mass, with an exponent of about -¼. However, the laws for the breathing rate hold only for basal activity; at higher metabolic rates, which are modeled here for the first time, the exponent deviates strongly from this value, in line with empirical data. Why is this paper important? The authors present a highly complex model of lung physiology that integrates a wide range of biophysical details and passes a difficult test: the successful prediction of unexplained scaling exponents. These scaling relations may help us transfer insights from animal models to humans and in reverse: data for breathing during exercise, which are easy to measure in humans, can be extrapolated to other species. Aside from the scaling laws, the model also reveals physiological mechanisms. In the larger lung branches, oxygen is transported mainly by air movement (convection), while in smaller branches air flow is slow and oxygen moves by diffusion. The transition between these regimes can occur at different depths in the lung: as the authors state, “the localization of this transition determines how ventilation should be controlled to minimize its energetic cost at any metabolic regime”. In the model, the optimal location for the transition depends on oxygen demand [5, 6]: the transition occurs deeper in the lung in exercise regimes than at rest, allowing for more oxygen to be taken up. However, the effects of this shift depend on body size: while small mammals generally use the entire exchange surface of their lungs, large mammals keep a reserve for higher activities, which becomes accessible as their transition zone moves at high metabolic rates. Hence, scaling can entail qualitative differences between species! Altogether, the paper shows how the dynamics of ventilation depend on lung morphology. But this may also play out in the other direction: if energy-efficient ventilation depends on body activity, and therefore on ecological niches, a niche may put evolutionary pressures on lung geometry. Hence, by understanding how deep and fast animals breathe, we may also learn about how behavior, physiology, and anatomy co-evolve. References [1] West GB, Brown JH, Enquist BJ (1997) A General Model for the Origin of Allometric Scaling Laws in Biology. Science 276 (5309), 122–126. https://doi.org/10.1126/science.276.5309.122 [2] Kleiber M (1947) Body size and metabolic rate. Physiological Reviews, 27, 511–541. https://doi.org/10.1152/physrev.1947.27.4.511 [3] Noël F., Karamaoun C., Dempsey J. A. and Mauroy B. (2021) The origin of the allometric scaling of lung's ventilation in mammals. arXiv, 2005.12362, ver. 6 peer-reviewed and recommended by Peer community in Mathematical and Computational Biology. https://arxiv.org/abs/2005.12362 [4] Otis AB, Fenn WO, Rahn H (1950) Mechanics of Breathing in Man. Journal of Applied Physiology, 2, 592–607. https://doi.org/10.1152/jappl.1950.2.11.592 [5] Noël F, Mauroy B (2019) Interplay Between Optimal Ventilation and Gas Transport in a Model of the Human Lung. Frontiers in Physiology, 10, 488. https://doi.org/10.3389/fphys.2019.00488 [6] Sapoval B, Filoche M, Weibel ER (2002) Smaller is better—but not too small: A physical scale for the design of the mammalian pulmonary acinus. Proceedings of the National Academy of Sciences, 99, 10411–10416. https://doi.org/10.1073/pnas.122352499 | The origin of the allometric scaling of lung ventilation in mammals | Frédérique Noël, Cyril Karamaoun, Jerome A. Dempsey, Benjamin Mauroy | <p>A model of optimal control of ventilation has recently been developed for humans. This model highlights the importance of the localization of the transition between a convective and a diffusive transport of respiratory gas. This localization de... | | Biophysics, Evolutionary Biology, Physiology | Wolfram Liebermeister | 2020-08-28 15:18:03 | ||
12 Oct 2023
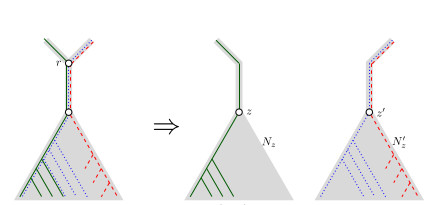
When Three Trees Go to WarBounding the reticulation number for three phylogenetic treesRecommended by Simone Linz based on reviews by Guillaume Scholz and Stefan GrünewaldReconstructing a phylogenetic network for a set of conflicting phylogenetic trees on the same set of leaves remains an active strand of research in mathematical and computational phylogenetic since 2005, when Baroni et al. [1] showed that the minimum number of reticulations h(T,T') needed to simultaneously embed two rooted binary phylogenetic trees T and T' into a rooted binary phylogenetic network is one less than the size of a maximum acyclic agreement forest for T and T'. In the same paper, the authors showed that h(T,T') is bounded from above by n-2, where n is the number of leaves of T and T' and that this bound is sharp. That is, for a fixed n, there exist two rooted binary phylogenetic trees T and T' such that h(T,T')=n-2. Since 2005, many papers have been published that develop exact algorithms and heuristics to solve the above NP-hard minimisation problem in practice, which is often referred to as Minimum Hybridisation in the literature, and that further investigate the mathematical underpinnings of Minimum Hybridisation and related problems. However, many such studies are restricted to two trees and much less is known about Minimum Hybridisation for when the input consists of more than two phylogenetic trees, which is the more relevant cases from a biological point of view. In [2], van Iersel, Jones, and Weller establish the first lower bound for the minimum reticulation number for more than two rooted binary phylogenetic trees, with a focus on exactly three trees. The above-mentioned connection between the minimum number of reticulations and maximum acyclic agreement forests does not extend to three (or more) trees. Instead, to establish their result, the authors use multi-labelled trees as an intermediate structure between phylogenetic trees and phylogenetic networks to show that, for each ε>0, there exist three caterpillar trees on n leaves such that any phylogenetic network that simultaneously embeds these three trees has at least (3/2 - ε)n reticulations. Perhaps unsurprising, caterpillar trees were also used by Baroni et al. [1] to establish that their upper bound on h(T,T') is sharp. Structurally, these trees have the property that each internal vertex is adjacent to a leaf. Each caterpillar tree can therefore be viewed as a sequence of characters, and it is exactly this viewpoint that is heavily used in [2]. More specifically, sequences with short common subsequences correspond to caterpillar trees that need many reticulations when embedded in a phylogenetic network. It would consequently be interesting to further investigate connections between caterpillar trees and certain types of sequences. Can they be used to shed more light on bounds for the minimum reticulation number? References [1] Baroni, M., Grünewald, S., Moulton, V., and Semple, C. (2005) "Bounding the number of hybridisation events for a consistent evolutionary history". J. Math. Biol. 51, 171–182. https://doi.org/10.1007/s00285-005-0315-9 | When Three Trees Go to War | Leo van Iersel and Mark Jones and Mathias Weller | <p style="text-align: justify;">How many reticulations are needed for a phylogenetic network to display a given set of k phylogenetic trees on n leaves? For k = 2, Baroni, Semple, and Steel [Ann. Comb. 8, 391-408 (2005)] showed that the answer is ... | | Combinatorics, Evolutionary Biology, Graph theory | Simone Linz | 2023-03-07 18:49:21 | ||
14 Mar 2023
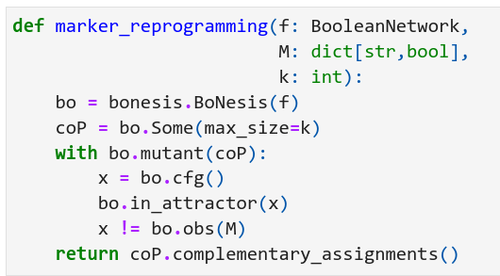
Marker and source-marker reprogramming of Most Permissive Boolean networks and ensembles with BoNesisReprogramming of locally-monotone Boolean networks with BoNesisRecommended by Sergiu Ivanov based on reviews by Ismail Belgacem and 1 anonymous reviewerReprogramming of cellular networks is a well known challenge in computational biology consisting first of all in properly representing an ensemble of networks having a role in a phenomenon of interest, and secondly in designing strategies to alter the functioning of this ensemble in the desired direction. Important applications involve disease study: a therapy can be seen as a reprogramming strategy, and the disease itself can be considered a result of a series of adversarial reprogramming actions. The origins of this domain go back to the seminal paper by Barabási et al. [1] which formalized the concept of network medicine. An abstract tool which has gathered considerable success in network medicine and network biology are Boolean networks: sets of Boolean variables, each equipped with a Boolean update function describing how to compute the next value of the variable from the values of the other variables. Despite apparent dissimilarity with the biological systems which involve varying quantities and continuous processes, Boolean networks have been very effective in representing biological networks whose entities are typically seen as being on or off. Particular examples are protein signalling networks as well as gene regulatory networks. The paper [2] by Loïc Paulevé presents a versatile tool for tackling reprogramming of Boolean networks seen as models of biological networks. The problem of reprogramming is often formulated as the problem of finding a set of perturbations which guarantee some properties on the attractors. The work [2] relies on the most permissive semantics [3], which together with the modelling assumption allows for considerable speed-up in the practically relevant subclass of locally-monotone Boolean networks. The paper is structured as a tutorial. It starts by introducing the formalism, defining 4 different general variants of reprogramming under the most permissive semantics, and presenting evaluations of their complexity in terms of the polynomial hierarchy. The author then describes the software tool BoNesis which can handle different problems related to Boolean networks, and in particular the 4 reprogramming variants. The presentation includes concrete code examples with their output, which should be very helpful for future users. The paper [2] introduces a novel scenario: reprogramming of ensembles of Boolean networks delineated by some properties, including for example the property of having a given interaction graph. Ensemble reprogramming looks particularly promising in situations in which the biological knowledge is insufficient to fully determine all the update functions, i.e. in the majority of modelling situations. Finally, the author also shows how BoNesis can be used to deal with sequential reprogramming, which is another promising direction in computational controllability, potentially enabling more efficient therapies [4,5]. REFERENCES
| Marker and source-marker reprogramming of Most Permissive Boolean networks and ensembles with BoNesis | Loïc Paulevé | <p style="text-align: justify;">Boolean networks (BNs) are discrete dynamical systems with applications to the modeling of cellular behaviors. In this paper, we demonstrate how the software BoNesis can be employed to exhaustively identify combinat... | | Combinatorics, Computational complexity, Dynamical systems, Molecular Biology, Systems biology | Sergiu Ivanov | Ismail Belgacem, Anonymous | 2022-08-31 15:00:21 | |
09 Sep 2020
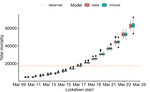
Bayesian investigation of SARS-CoV-2-related mortality in FranceModeling the effect of lockdown and other events on the dynamics of SARS-CoV-2 in FranceRecommended by Valery Forbes based on reviews by Wayne Landis and 1 anonymous reviewerThis study [1] used Bayesian models of the number of deaths through time across different regions of France to explore the effects of lockdown and other events (i.e., holding elections) on the dynamics of the SARS-CoV-2 epidemic. The models accurately predicted the number of deaths 2 to 3 weeks in advance, and results were similar to other recent models using different structure and input data. Viral reproduction numbers were not found to be different between weekends and week days, and there was no evidence that holding elections affected the number of deaths directly. However, exploring different scenarios of the timing of the lockdown showed that this had a substantial impact on the number of deaths. This is an interesting and important paper that can inform adaptive management strategies for controlling the spread of this virus, not just in France, but in other geographic areas. For example, the results found that there was a lag period between a change in management strategies (lockdown, social distancing, and the relaxing of controls) and the observed change in mortality. Also, there was a large variation in the impact of mitigation measures on the viral reproduction number depending on region, with lockdown being slightly more effective in denser regions. The authors provide an extensive amount of additional data and code as supplemental material, which increase the value of this contribution to the rapidly growing literature on SARS-CoV-2. References [1] Duchemin, L., Veber, P. and Boussau, B. (2020) Bayesian investigation of SARS-CoV-2-related mortality in France. medRxiv 2020.06.09.20126862, ver. 5 peer-reviewed and recommended by PCI Mathematical & Computational Biology. doi: 10.1101/2020.06.09.20126862 | Bayesian investigation of SARS-CoV-2-related mortality in France | Louis Duchemin, Philippe Veber, Bastien Boussau | <p>The SARS-CoV-2 epidemic in France has focused a lot of attention as it hashad one of the largest death tolls in Europe. It provides an opportunity to examine the effect of the lockdown and of other events on the dynamics of the epidemic. In par... | | Probability and statistics | Valery Forbes | 2020-07-08 17:29:46 | ||
10 Apr 2024
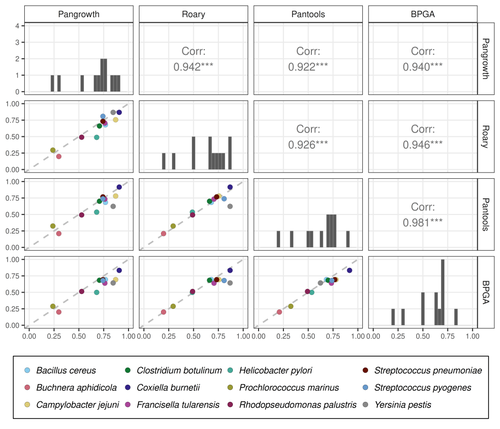
Revisiting pangenome openness with k-mersFaster method for estimating the openness of speciesRecommended by Leo van Iersel based on reviews by Guillaume Marçais, Abiola Akinnubi and 1 anonymous reviewerWhen sequencing more and more genomes of a species (or a group of closely related species), a natural question to ask is how quickly the total number of distinct sequences grows as a function of the total number of sequenced genomes. A similar question can be asked about the number of distinct genes or the number of distinct k-mers (length-k subsequences). References [1] Parmigiani L., Wittler, R. and Stoye, J. (2024) "Revisiting pangenome openness with k-mers". bioRxiv, ver. 4 peer-reviewed and recommended by Peer Community In Mathematical and Computational Biology. https://doi.org/10.1101/2022.11.15.516472 | Revisiting pangenome openness with k-mers | Luca Parmigiani, Roland Wittler, Jens Stoye | <p style="text-align: justify;">Pangenomics is the study of related genomes collectively, usually from the same species or closely related taxa. Originally, pangenomes were defined for bacterial species. After the concept was extended to eukaryoti... | | Combinatorics, Genomics and Transcriptomics | Leo van Iersel | Guillaume Marçais, Yadong Zhang | 2022-11-22 14:48:18 |


