Latest recommendations
| Id | Title * | Authors * | Abstract * | Picture * | Thematic fields * ▲ | Recommender | Reviewers | Submission date | |
|---|---|---|---|---|---|---|---|---|---|
07 Dec 2021
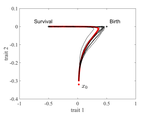
The emergence of a birth-dependent mutation rate in asexuals: causes and consequencesFlorian Patout, Raphaël Forien, Matthieu Alfaro, Julien Papaïx, Lionel Roques https://doi.org/10.1101/2021.06.11.448026A new perspective in modeling mutation rate for phenotypically structured populationsRecommended by Yuan Lou based on reviews by Hirohisa Kishino and 1 anonymous reviewerIn standard mutation-selection models for describing the dynamics of phenotypically structured populations, it is often assumed that the mutation rate is constant across the phenotypes. In particular, this assumption leads to a constant diffusion coefficient for diffusion approximation models (Perthame, 2007 and references therein). Patout et al (2021) study the dependence of the mutation rate on the birth rate, by introducing some diffusion approximations at the population level, derived from the large population limit of a stochastic, individual-based model. The reaction-diffusion model in this article is of the “cross-diffusion” type: The form of “cross-diffusion” also appeared in ecological literature as a type of biased movement behaviors for organisms (Shigesada et al., 1979). The key underlying assumption for “cross-diffusion” is that the transition probability at the individual level depends solely upon the condition at the departure point. Patout et al (2021) envision that a higher birth rate yields more mutations per unit of time. One of their motivations is that during cancer development, the mutation rates of cancer cells at the population level could be correlated with reproduction success. The reaction-diffusion approximation model derived in this article illustrates several interesting phenomena: For the time evolution situation, their model predicts different solution trajectories under various assumptions on the fitness function, e.g. the trajectory could initially move towards the birth optimum but eventually end up at the survival optimum. Their model also predicts that the mean fitness could be flat for some period of time, which might provide another alternative to explain observed data. At the steady-state level, their model suggests that the populations are more concentrated around the survival optimum, which agrees with the evolution of the time-dependent solution trajectories. Perhaps one of the most interesting contributions of the study of Patout et al (2021) is to give us a new perspective to model the mutation rate in phenotypically structured populations and subsequently, and to help us better understand the connection between mutation and selection. More broadly, this article offers some new insights into the evolutionary dynamics of phenotypically structured populations, along with potential implications in empirical studies. References Perthame B (2007) Transport Equations in Biology Frontiers in Mathematics. Birkhäuser, Basel. https://doi.org/10.1007/978-3-7643-7842-4_2 Patout F, Forien R, Alfaro M, Papaïx J, Roques L (2021) The emergence of a birth-dependent mutation rate in asexuals: causes and consequences. bioRxiv, 2021.06.11.448026, ver. 3 peer-reviewed and recommended by Peer Community in Mathematical and Computational Biology. https://doi.org/10.1101/2021.06.11.448026 Shigesada N, Kawasaki K, Teramoto E (1979) Spatial segregation of interacting species. Journal of Theoretical Biology, 79, 83–99. https://doi.org/10.1016/0022-5193(79)90258-3 | The emergence of a birth-dependent mutation rate in asexuals: causes and consequences | Florian Patout, Raphaël Forien, Matthieu Alfaro, Julien Papaïx, Lionel Roques | <p style="text-align: justify;">In unicellular organisms such as bacteria and in most viruses, mutations mainly occur during reproduction. Thus, genotypes with a high birth rate should have a higher mutation rate. However, standard models of asexu... |  | Dynamical systems, Evolutionary Biology, Probability and statistics, Stochastic dynamics | Yuan Lou | Anonymous, Hirohisa Kishino | 2021-06-12 13:59:45 | View |
13 Aug 2024
Phenotype control and elimination of variables in Boolean networksElisa Tonello, Loïc Paulevé https://doi.org/10.48550/arXiv.2406.02304Disclosing effects of Boolean network reduction on dynamical properties and control strategiesRecommended by Claudine Chaouiya based on reviews by Tomas Gedeon and David Safranek based on reviews by Tomas Gedeon and David Safranek
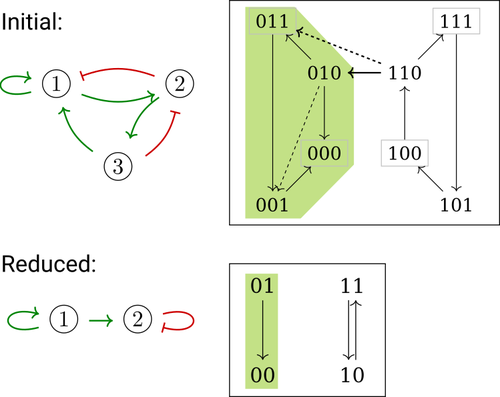
Boolean networks stem from seminal work by M. Sugita [1], S. Kauffman [2] and R. Thomas [3] over half a century ago. Since then, a very active field of research has been developed, leading to theoretical advances accompanied by a wealth of work on modelling genetic and signalling networks involved in a wide range of cellular processes. Boolean networks provide a successful formalism for the mathematical modelling of biological processes, with a qualitative abstraction particularly well adapted to handle the modelling of processes for which precise, quantitative data is barely available. Nevertheless, these abstract models reveal fundamental dynamical properties, such as the existence and reachability of attractors, which embody stable cellular responses (e.g. differentiated states). Analysing these properties still faces serious computational complexity. Reduction of model size was proposed as a mean to cope with this issue. Furthermore, to enhance the capacity of Boolean networks to produce relevant predictions, formal methods have been developed to systematically identify control strategies enforcing desired behaviours. In their paper, E. Tonello and L. Paulevé [4] assess the most popular reduction that consists in eliminating a model component. Considering three typical update schemes (synchronous, asynchronous and general asynchronous updates), they thoroughly study the effects of the reduction on attractors, minimal trap spaces (minimal subspaces from which the model dynamics cannot leave), and on phenotype controls (interventions which guarantee that the dynamics ends in a phenotype defined by specific component values). Because they embody potential behaviours of the biological process under study, these are all properties of great interest for a modeller. The authors show that eliminating a component can significantly affect some dynamical properties and may turn a control strategy ineffective. The different update schemes, targets of phenotype control and control strategies are carefully handled with useful supporting examples. Overall, E. Tonello and L. Paulevé’s contribution underlines the need for caution when defining a regulatory network and characterises the consequences on critical model properties when discarding a component [4]. References [1] Motoyosi Sugita (1963) Functional analysis of chemical systems in vivo using a logical circuit equivalent. II. The idea of a molecular automation. Journal of Theoretical Biology, 4, 179–92. https://doi.org/10.1016/0022-5193(63)90027-4 [2] Stuart Kauffman (1969) Metabolic stability and epigenesis in randomly constructed genetic nets. Journal of Theoretical Biology, 22, 437–67. https://doi.org/10.1016/0022-5193(69)90015-0 [3] René Thomas (1973) Boolean formalization of genetic control circuits. Journal of Theoretical Biology, 42, 563–85. https://doi.org/10.1016/0022-5193(73)90247-6 [4] Elisa Tonello, Loïc Paulevé (2024) Phenotype control and elimination of variables in Boolean networks. arXiv, ver.2 peer-reviewed and recommended by PCI Math Comp Biol https://arxiv.org/abs/2406.02304 | Phenotype control and elimination of variables in Boolean networks | Elisa Tonello, Loïc Paulevé | <p>We investigate how elimination of variables can affect the asymptotic dynamics and phenotype control of Boolean networks. In particular, we look at the impact on minimal trap spaces, and identify a structural condition that guarantees their pre... |  | Dynamical systems, Systems biology | Claudine Chaouiya | 2024-06-05 10:12:39 | View | |
27 Jul 2021
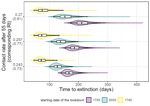
Estimating dates of origin and end of COVID-19 epidemicsThomas Bénéteau, Baptiste Elie, Mircea T. Sofonea, Samuel Alizon https://doi.org/10.1101/2021.01.19.21250080The importance of model assumptions in estimating the dynamics of the COVID-19 epidemicRecommended by Valery Forbes based on reviews by Bastien Boussau and 1 anonymous reviewerIn “Estimating dates of origin and end of COVID-19 epidemics”, Bénéteau et al. develop and apply a mathematical modeling approach to estimate the date of the origin of the SARS-CoV-2 epidemic in France. They also assess how long strict control measures need to last to ensure that the prevalence of the virus remains below key public health thresholds. This problem is challenging because the numbers of infected individuals in both tails of the epidemic are low, which can lead to errors when deterministic models are used. To achieve their goals, the authors developed a discrete stochastic model. The model is non-Markovian, meaning that individual infection histories influence the dynamics. The model also accounts for heterogeneity in the timing between infection and transmission and includes stochasticity as well as consideration of superspreader events. By comparing the outputs of their model with several alternative models, Bénéteau et al. were able to assess the importance of stochasticity, individual heterogeneity, and non-Markovian effects on the estimates of the dates of origin and end of the epidemic, using France as a test case. Some limitations of the study, which the authors acknowledge, are that the time from infection to death remains largely unknown, a lack of data on the heterogeneity of transmission among individuals, and the assumption that only a single infected individual caused the epidemic. Despite the acknowledged limitations of the work, the results suggest that cases may be detected long before the detection of an epidemic wave. Also, the approach may be helpful for informing public health decisions such as the necessary duration of strict lockdowns and for assessing the risks of epidemic rebound as restrictions are lifted. In particular, the authors found that estimates of the end of the epidemic following lockdowns are more sensitive to the assumptions of the models used than estimates of its beginning. In summary, this model adds to a valuable suite of tools to support decision-making in response to disease epidemics. References Bénéteau T, Elie B, Sofonea MT, Alizon S (2021) Estimating dates of origin and end of COVID-19 epidemics. medRxiv, 2021.01.19.21250080, ver. 3 peer-reviewed and recommended by Peer Community in Mathematical and Computational Biology. https://doi.org/10.1101/2021.01.19.21250080 | Estimating dates of origin and end of COVID-19 epidemics | Thomas Bénéteau, Baptiste Elie, Mircea T. Sofonea, Samuel Alizon | <p style="text-align: justify;">Estimating the date at which an epidemic started in a country and the date at which it can end depending on interventions intensity are important to guide public health responses. Both are potentially shaped by simi... |  | Epidemiology, Probability and statistics, Stochastic dynamics | Valery Forbes | 2021-02-23 16:37:32 | View | |
30 Mar 2025
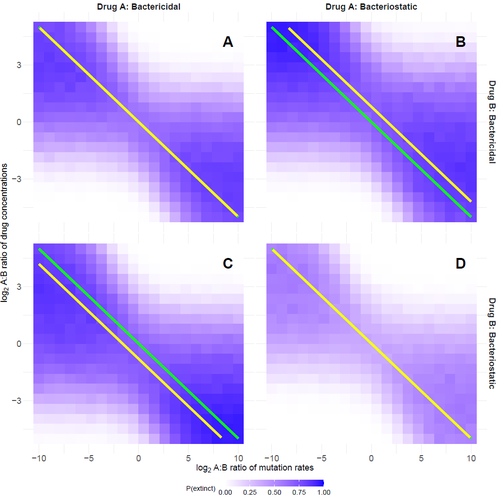
Optimal antimicrobial dosing combinations when drug-resistance mutation rates differOscar Delaney, Andrew D. Letten, Jan Engelstaedter https://doi.org/10.1101/2024.05.04.592498Optimizing antibiotic use: How much should we favor drugs with lower resistance mutation rates?Recommended by Amaury Lambert based on reviews by 2 anonymous reviewersIn the hereby recommended paper [1], Delaney, Letten and Engelstädter study the appearance of antibiotic resistance(s) in a bacterial population subject to a combination of two antibiotics \( A \) and \( B \), in concentrations \( C_A \) and \( C_B \) respectively. Their goal was to find optimal values of \( C_A \) and \( C_B \) that minimize the risk of evolutionary rescue, under the unusual assumption that resistance mutations to either antibiotic are not equally likely. The authors introduce a stochastic model assuming that the susceptible population grows like a supercritical birth-death process which becomes subcritical in the presence of antibiotics (and exactly critical for a certain concentration c of a single antibiotic): the effect of each antibiotic is either to reduce division rate (bacteriostatic drug) or to enhance death rate (bacteriocidal drug) by a factor which has a sigmoid functional dependence on antibiotic concentration. Now at each division, a resistance mutation can arise, with probability \( \mu_A \) for a resistance to antibiotic \( A \) and with probability \( \mu_B \) for a resistance to antibiotic \( B \). The goal of the paper is to find the optimal ratio of drug concentrations \( C_A \) and \( C_B \) when these are subject to a constrain \( C_A + C_B = c \), depending on the ratio of mutation rates. Assuming total resistance and no cross resistance, the authors show that the optimal concentrations are given by \( C_A = c/(1+\sqrt{\mu_A/\mu_B }) \) and \( C_B = c/(1+\sqrt{\mu_B/\mu_A}) \), which leads to the beautiful result that the optimal ratio \( C_A/C_B \) is equal to the square root of \( \mu_B/\mu_A \). The authors have made a great job completing their initial submission by simulations of model extensions, relaxing assumptions like single antibiotic mode, absence of competition, absence of cost of resistance, sharp cutoff in toxicity… and comparing the results obtained by simulation to their mathematical result. The paper is very clearly written and any reader interested in antibiotic resistance, stochastic modeling of bacterial populations and/or evolutionary rescue will enjoy reading it. Let me thank the authors for their patience and for their constant willingness to comply with the reviewers’ and recommender’s demands during the reviewing process.
Reference Oscar Delaney, Andrew D. Letten, Jan Engelstaedter (2025) Optimal antimicrobial dosing combinations when drug-resistance mutation rates differ. bioRxiv, ver.3 peer-reviewed and recommended by PCI Mathematical and Computational Biology https://doi.org/10.1101/2024.05.04.592498 | Optimal antimicrobial dosing combinations when drug-resistance mutation rates differ | Oscar Delaney, Andrew D. Letten, Jan Engelstaedter | <p>Given the ongoing antimicrobial resistance crisis, it is imperative to develop dosing regimens optimised to avoid the evolution of resistance. The rate at which bacteria acquire resistance-conferring mutations to different antimicrobial drugs s... |  | Evolutionary Biology | Amaury Lambert | 2024-05-07 17:17:55 | View | |
22 Jul 2024
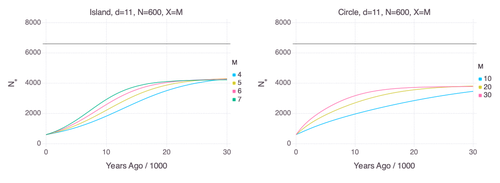
Genetic Evidence for Geographic Structure within the Neanderthal PopulationAlan R. Rogers https://doi.org/10.1101/2023.07.28.551046Decline in Neanderthal effective population size due to geographic structure and gene flowRecommended by Raquel Assis based on reviews by David Bryant and Guillaume AchazPublished PSMC estimates of Neanderthal effective population size (𝑁e) show an approximately five-fold decline over the past 20,000 years [1]. This observation may be attributed to a true decline in Neanderthal 𝑁e, statistical error that is notorious with PSMC estimation, or geographic subdivision and gene flow that has been hypothesized to occur within the Neanderthal population. Determining which of these factors contributes to the observed decline in Neanderthal 𝑁e is an important question that can provide insight into human evolutionary history. Though it is widely believed that the decline in Neanderthal 𝑁e is due to geographic subdivision and gene flow, no prior studies have theoretically examined whether these evolutionary processes can yield the observed pattern. In this paper [2], Rogers tackles this problem by employing two mathematical models to explore the roles of geographic subdivision and gene flow in the Neanderthal population. Results from both models show that geographic subdivision and gene flow can indeed result in a decline in 𝑁e that mirrors the observed decline estimated from empirical data. In contrast, Rogers argues that neither statistical error in PSMC estimates nor a true decline in 𝑁e are expected to produce the consistent decline in estimated 𝑁e observed across three distinct Neanderthal fossils. Statistical error would likely result in variation among these curves, whereas a true decline in 𝑁e would produce shifted curves due to the different ages of the three Neanderthal fossils. In summary, Rogers provides convincing evidence that the most reasonable explanation for the observed decline in Neanderthal 𝑁e is geographic subdivision and gene flow. Rogers also provides a basis for understanding this observation, suggesting that 𝑁e declines over time because coalescence times are shorter between more recent ancestors, as they are more likely to be geographic neighbors. Hence, Rogers’ theoretical findings shed light on an interesting aspect of human evolutionary history. References [1] Fabrizio Mafessoni, Steffi Grote, Cesare de Filippo, Svante Pääbo (2020) “A high-coverage Neandertal genome from Chagyrskaya Cave”. Proceedings of the National Academy of Sciences USA 117: 15132- 15136. https://doi.org/10.1073/pnas.2004944117 [2] Alan Rogers (2024) “Genetic evidence for geographic structure within the Neanderthal population”. bioRxiv, version 4 peer-reviewed and recommended by Peer Community in Mathematical and Computational Biology. https://doi.org/10.1101/2023.07.28.551046 | Genetic Evidence for Geographic Structure within the Neanderthal Population | Alan R. Rogers | <p>PSMC estimates of Neanderthal effective population size (N<sub>e</sub>)exhibit a roughly 5-fold decline across the most recent 20 ky before the death of each fossil. To explain this pattern, this article develops new theory relating... |  | Evolutionary Biology, Genetics and population Genetics | Raquel Assis | 2023-10-17 18:06:38 | View | |
10 Jan 2024
An approximate likelihood method reveals ancient gene flow between human, chimpanzee and gorillaNicolas Galtier https://doi.org/10.1101/2023.07.06.547897Aphid: A Novel Statistical Method for Dissecting Gene Flow and Lineage Sorting in Phylogenetic ConflictRecommended by Alan Rogers based on reviews by Richard Durbin and 2 anonymous reviewers based on reviews by Richard Durbin and 2 anonymous reviewers
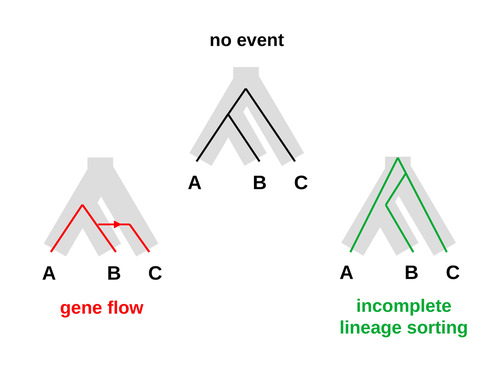
Galtier [1] introduces “Aphid,” a new statistical method that estimates the contributions of gene flow (GF) and incomplete lineage sorting (ILS) to phylogenetic conflict. Aphid is based on the observation that GF tends to make gene genealogies shorter, whereas ILS makes them longer. Rather than fitting the full likelihood, it models the distribution of gene genealogies as a mixture of several canonical gene genealogies in which coalescence times are set equal to their expectations under different models. This simplification makes Aphid far faster than competing methods. In addition, it deals gracefully with bidirectional gene flow—an impossibility under competing models. Because of these advantages, Aphid represents an important addition to the toolkit of evolutionary genetics. In the interest of speed, Aphid makes several simplifying assumptions. Yet even when these were violated, Aphid did well at estimating parameters from simulated data. It seems to be reasonably robust. Aphid studies phylogenetic conflict, which occurs when some loci imply one phylogenetic tree and other loci imply another. This happens when the interval between successive speciation events is fairly short. If this interval is too short, however, Aphid’s approximations break down, and its estimates are biased. Galtier suggests caution when the fraction of discordant phylogenetic trees exceeds 50–55%. Thus, Aphids will be most useful when the interval between speciation events is short, but not too short. Galtier applies the new method to three sets of primate data. In two of these data sets (baboons and African apes), Aphid detects gene flow that would likely be missed by competing methods. These competing methods are primarily sensitive to gene flow that is asymmetric in two senses: (1) greater flow in one direction than the other, and (2) unequal gene flow connecting an outgroup to two sister species. Aphid finds evidence of symmetric gene flow in the ancestry of baboons and also in that of African apes. The data suggest that ancestral humans and chimpanzees both interbred with ancestral gorillas, and at about the same rate. Aphid’s ability to detect this signature sets it apart from competing methods. References [1] Nicolas Galtier (2023) “An approximate likelihood method reveals ancient gene flow between human, chimpanzee and gorilla”. bioRxiv, ver. 3 peer-reviewed and recommended by Peer Community in Mathematical and Computational Biology. https://doi.org/10.1101/2023.07.06.547897 | An approximate likelihood method reveals ancient gene flow between human, chimpanzee and gorilla | Nicolas Galtier | <p>Gene flow and incomplete lineage sorting are two distinct sources of phylogenetic conflict, i.e., gene trees that differ in topology from each other and from the species tree. Distinguishing between the two processes is a key objective of curre... |  | Evolutionary Biology, Genetics and population Genetics, Genomics and Transcriptomics | Alan Rogers | 2023-07-06 18:41:16 | View | |
18 Apr 2023
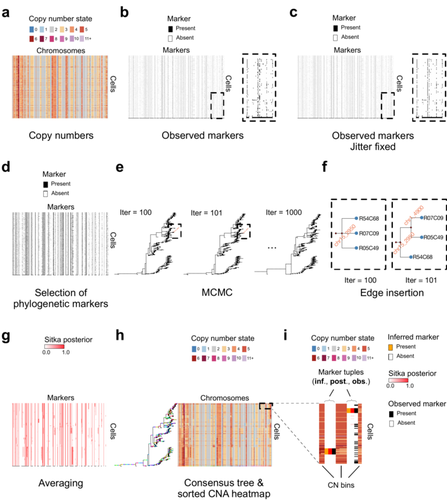
Cancer phylogenetic tree inference at scale from 1000s of single cell genomesSohrab Salehi, Fatemeh Dorri, Kevin Chern, Farhia Kabeer, Nicole Rusk, Tyler Funnell, Marc J Williams, Daniel Lai, Mirela Andronescu, Kieran R. Campbell, Andrew McPherson, Samuel Aparicio, Andrew Roth, Sohrab Shah, and Alexandre Bouchard-Côté https://doi.org/10.1101/2020.05.06.058180Phylogenetic reconstruction from copy number aberration in large scale, low-depth genome-wide single-cell data.Recommended by Amaury Lambert based on reviews by 3 anonymous reviewersThe paper [1] presents and applies a new Bayesian inference method of phylogenetic reconstruction for multiple sequence alignments in the case of low sequencing coverage but diverse copy number aberrations (CNA), with applications to single cell sequencing of tumors. The idea is to take advantage of CNA to reconstruct the topology of the phylogenetic tree of sequenced cells in a first step (the `sitka' method), and in a second step to assign single nucleotide variants (SNV) to tree edges (and then calibrate their lengths) (the `sitka-snv' method). The data are summarized into a binary-valued CxL matrix Y, where C is the number of cells and L is the number of loci (here, loci are segments of prescribed length called `bins'). The entry of Y at row i and column j is 1 (otherwise 0) iff in the ancestral lineage of cell i, at least one genomic rearrangement has occurred, and more specifically the gain or loss of a segment with at least one endpoint in locus j or in locus j+1. The authors expect the infinite-allele assumption to approximately hold (i.e., that at most one mutation occurs at any given marker and that 0 is the ancestral state). They refer to this assumption as the `perfect phylogeny assumption'. By only recording from CNA events the endpoints at which they occur, the authors lose the information on copy number, but they gain the assumption of independence of the mutational processes occurring at different sites, which approximately holds for CNA endpoints. The goal of sitka is to produce a posterior distribution on phylogenetic trees conditional on the matrix Y , where here a phylogenetic tree is understood as containing the information on 1) the topology of the tree but not its edge lengths, and 2) for each edge, the identity of markers having undergone a mutation, in the sense of the previous paragraph. The results of the method are tested against synthetic datasets simulated under various assumptions, including conditions violating the perfect phylogeny assumption and compared to results obtained under other baseline methods. The method is extended to assign SNV to edges of the tree inferred by sitka. It is also applied to real datasets of single cell genomes of tumors. The manuscript is very well-written, with a high degree of detail. The method is novel, scalable, fast and appears to perform favorably compared to other approaches. It has been applied in independent publications, for example to multi-year time-series single-cell whole-genome sequencing of tumors, in order to infer the fitness landscape and its dynamics through time, see [2]. The reviewing process has taken too long, mainly because of other commitments I had during the period and to the difficulty of finding reviewers. Let me apologize to the authors and thank them for their patience as well as for the scientific rigor they brought to their revisions and answers to reviewers, who I also warmly thank for their quality work. REFERENCES [1] Sohrab Salehi, Fatemeh Dorri, Kevin Chern, Farhia Kabeer, Nicole Rusk, Tyler Funnell, Marc J Williams, Daniel Lai, Mirela Andronescu, Kieran R. Campbell, Andrew McPherson, Samuel Aparicio, Andrew Roth, Sohrab Shah, and Alexandre Bouchard-Côté. Cancer phylogenetic tree inference at scale from 1000s of single cell genomes (2023). bioRxiv, 2020.05.06.058180, ver. 4 peer-reviewed and recommended by Peer Community in Mathematical and Computational Biology. [2] Sohrab Salehi, Farhia Kabeer, Nicholas Ceglia, Mirela Andronescu, Marc J. Williams, Kieran R. Campbell, Tehmina Masud, Beixi Wang, Justina Biele, Jazmine Brimhall, David Gee, Hakwoo Lee, Jerome Ting, Allen W. Zhang, Hoa Tran, Ciara O’Flanagan, Fatemeh Dorri, Nicole Rusk, Teresa Ruiz de Algara, So Ra Lee, Brian Yu Chieh Cheng, Peter Eirew, Takako Kono, Jenifer Pham, Diljot Grewal, Daniel Lai, Richard Moore, Andrew J. Mungall, Marco A. Marra, IMAXT Consortium, Andrew McPherson, Alexandre Bouchard-Côté, Samuel Aparicio & Sohrab P. Shah. Clonal fitness inferred from time-series modelling of single-cell cancer genomes (2021). Nature 595, 585–590. https://doi.org/10.1038/s41586-021-03648-3 | Cancer phylogenetic tree inference at scale from 1000s of single cell genomes | Sohrab Salehi, Fatemeh Dorri, Kevin Chern, Farhia Kabeer, Nicole Rusk, Tyler Funnell, Marc J Williams, Daniel Lai, Mirela Andronescu, Kieran R. Campbell, Andrew McPherson, Samuel Aparicio, Andrew Roth, Sohrab Shah, and Alexandre Bouchard-Côté | <p style="text-align: justify;">A new generation of scalable single cell whole genome sequencing (scWGS) methods allows unprecedented high resolution measurement of the evolutionary dynamics of cancer cell populations. Phylogenetic reconstruction ... |  | Evolutionary Biology, Genetics and population Genetics, Genomics and Transcriptomics, Machine learning, Probability and statistics | Amaury Lambert | 2021-12-10 17:08:04 | View | |
02 May 2023
Population genetics: coalescence rate and demographic parameters inferenceOlivier Mazet, Camille Noûs https://doi.org/10.48550/arXiv.2207.02111Estimates of Effective Population Size in Subdivided PopulationsRecommended by Alan Rogers based on reviews by 2 anonymous reviewers based on reviews by 2 anonymous reviewers
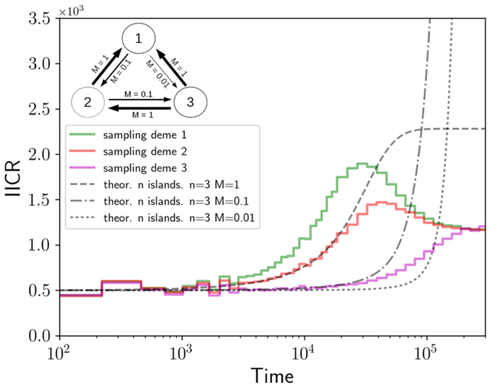
We often use genetic data from a single site, or even a single individual, to estimate the history of effective population size, Ne, over time scales in excess of a million years. Mazet and Noûs [2] emphasize that such estimates may not mean what they seem to mean. The ups and downs of Ne may reflect changes in gene flow or selection, rather than changes in census population size. In fact, gene flow may cause Ne to decline even if the rate of gene flow has remained constant. Consider for example the estimates of archaic population size in Fig. 1, which show an apparent decline in population size between roughly 700 kya and 300 kya. It is tempting to interpret this as evidence of a declining number of individuals, but that is not the only plausible interpretation. Each of these estimates is based on the genome of a single diploid individual. As we trace the ancestry of that individual backwards into the past, the ancestors are likely to remain in the same locale for at least a generation or two. Being neighbors, there’s a chance they will mate. This implies that in the recent past, the ancestors of a sampled individual lived in a population of small effective size. As we continue backwards into the past, there is more and more time for the ancestors to move around on the landscape. The farther back we go, the less likely they are to be neighbors, and the less likely they are to mate. In this more remote past, the ancestors of our sample lived in a population of larger effective size, even if neither the number of individuals nor the rate of gene flow has changed. For awhile then, Ne should increase as we move backwards into the past. This process does not continue forever, because eventually the ancestors will be randomly distributed across the population as a whole. We therefore expect Ne to increase towards an asymptote, which represents the effective size of the entire population. This simple story gets more complex if there is change in either the census size or the rate of gene flow. Mazet and Noûs [2] have shown that one can mimic real estimates of population history using models in which the rate of gene flow varies, but census size does not. This implies that the curves in Fig. 1 are ambiguous. The observed changes in Ne could reflect changes in census size, gene flow, or both. For this reason, Mazet and Noûs [2] would like to replace the term “effective population size” with an alternative, the “inverse instantaneous coalescent rate,” or IIRC. I don’t share this preference, because the same critique could be made of all definitions of Ne. For example, Wright [3, p. 108] showed in 1931 that Ne varies in response to the sex ratio, and this implies that changes in Ne need not involve any change in census size. This is also true when populations are geographically structured, as Mazet and Noûs [2] have emphasized, but this does not seem to require a new vocabulary.
Figure 1: PSMC estimates of the history of population size based on three archaic genomes: two Neanderthals and a Denisovan [1]. Mazet and Noûs [2] also show that estimates of Ne can vary in response to selection. It is not hard to see why such an effect might exist. In genomic regions affected by directional or purifying selection, heterozygosity is low, and common ancestors tend to be recent. Such regions may contribute to small estimates of recent Ne. In regions under balancing selection, heterozygosity is high, and common ancestors tend to be ancient. Such regions may contribute to large estimates of ancient Ne. The magnitude of this effect presumably depends on the fraction of the genome under selection and the rate of recombination. In summary, this article describes several processes that can affect estimates of the history of effective population size. This makes existing estimates ambiguous. For example, should we interpret Fig. 1 as evidence of a declining number of archaic individuals, or in terms of gene flow among archaic subpopulations? But these questions also present research opportunities. If the observed decline reflects gene flow, what does this imply about the geographic structure of archaic populations? Can we resolve the ambiguity by integrating samples from different locales, or using archaeological estimates of population density or interregional trade? REFERENCES [1] Fabrizio Mafessoni et al. “A high-coverage Neandertal genome from Chagyrskaya Cave”. Proceedings of the National Academy of Sciences, USA 117.26 (2020), pp. 15132–15136. https://doi.org/10.1073/pnas.2004944117 [2] Olivier Mazet and Camille Noûs. “Population genetics: coalescence rate and demographic parameters inference”. arXiv, ver. 2 peer-reviewed and recommended by Peer Community In Mathematical and Computational Biology (2023). https://doi.org/10.48550/ARXIV.2207.02111. [3] Sewall Wright. “Evolution in mendelian populations”. Genetics 16 (1931), pp. 97–159. https://doi.org/10.48550/ARXIV.2207.0211110.1093/genetics/16.2.97. | Population genetics: coalescence rate and demographic parameters inference | Olivier Mazet, Camille Noûs | <p style="text-align: justify;">We propose in this article a brief description of the work, over almost a decade, resulting from a collaboration between mathematicians and biologists from four different research laboratories, identifiable as the c... |  | Genetics and population Genetics, Probability and statistics | Alan Rogers | Joseph Lachance, Anonymous | 2022-07-11 14:03:04 | View |
21 Oct 2024
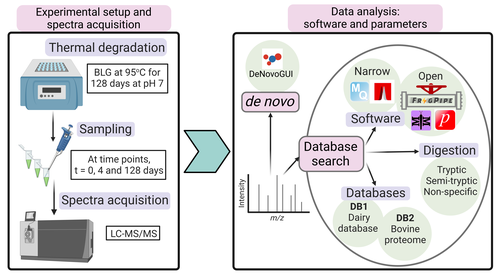
Benchmarking the identification of a single degraded protein to explore optimal search strategies for ancient proteinsIsmael Rodriguez-Palomo, Bharath Nair, Yun Chiang, Joannes Dekker, Benjamin Dartigues, Meaghan Mackie, Miranda Evans, Ruairidh Macleod, Jesper V. Olsen, Matthew J. Collins https://doi.org/10.1101/2023.12.15.571577Systematic investigation of software tools and design of a tailored pipeline for paleoproteomics researchRecommended by Raquel Assis based on reviews by Shevan Wilkin and 1 anonymous reviewerPaleoproteomics is a rapidly growing field with numerous challenges, many of which are due to the highly fragmented, modified, and degraded nature of ancient proteins. Though there are established standards for analysis, it is unclear how different software tools affect the identification and quantification of peptides, proteins, and post-translational modifications. To address this knowledge gap, Rodriguez Palomo et al. design a controlled system by experimentally degrading and purifying bovine beta-lactoglobulin, and then systematically compare the performance of many commonly used tools in its analysis. They present comprehensive investigations of false discovery rates, open and narrow searches, de novo sequencing coverage bias and accuracy, and peptide chemical properties and bias. In each investigation, they explore wide ranges of appropriate tools and parameters, providing guidelines and recommendations for best practices. Based on their findings, Rodriguez Palomo et al. develop a proposed pipeline that is tailored for the analysis of ancient proteins. This pipeline is an important contribution to paleoproteomics and is likely to be of great value to the research community, as it is designed to enhance power, accuracy, and consistency in studies of ancient proteins. References Ismael Rodriguez-Palomo, Bharath Nair, Yun Chiang, Joannes Dekker, Benjamin Dartigues, Meaghan Mackie, Miranda Evans, Ruairidh Macleod, Jesper V. Olsen, Matthew J. Collins (2023) Benchmarking the identification of a single degraded protein to explore optimal search strategies for ancient proteins. bioRxiv, ver.3 peer-reviewed and recommended by PCI Math Comp Biol https://doi.org/10.1101/2023.12.15.571577 | Benchmarking the identification of a single degraded protein to explore optimal search strategies for ancient proteins | Ismael Rodriguez-Palomo, Bharath Nair, Yun Chiang, Joannes Dekker, Benjamin Dartigues, Meaghan Mackie, Miranda Evans, Ruairidh Macleod, Jesper V. Olsen, Matthew J. Collins | <p style="text-align: justify;">Palaeoproteomics is a rapidly evolving discipline, and practitioners are constantly developing novel strategies for the analyses and interpretations of complex, degraded protein mixtures. The community has also esta... |  | Genomics and Transcriptomics, Probability and statistics | Raquel Assis | Anonymous, Shevan Wilkin | 2024-03-12 15:17:08 | View |
27 Sep 2024
In silico identification of switching nodes in metabolic networksFrancis Mairet https://doi.org/10.1101/2023.05.17.541195A computational method to identify key players in metabolic rewiringRecommended by Claudine Chaouiya based on reviews by 2 anonymous reviewers based on reviews by 2 anonymous reviewers
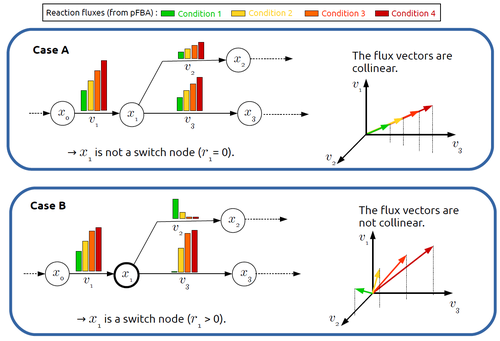
Significant progress has been made in developing computational methods to tackle the analysis of the numerous (genome-wide scale) metabolic networks that have been documented for a wide range of species. Understanding the behaviours of these complex reaction networks is crucial in various domains such as biotechnology and medicine. Metabolic rewiring is essential as it enables cells to adapt their metabolism to changing environmental conditions. Identifying the metabolites around which metabolic rewiring occurs is certainly useful in the case of metabolic engineering, which relies on metabolic rewiring to transform micro-organisms into cellular factories [1], as well as in other contexts. This paper by F. Mairet [2] introduces a method to disclose these metabolites, named switch nodes, relying on the analysis of the flux distributions for different input conditions. Basically, considering fluxes for different inputs, which can be computed using e.g. Parsimonious Flux Balance Analysis (pFBA), the proposed method consists in identifying metabolites involved in reactions whose different flux vectors are not collinear. The approach is supported by four case studies, considering core and genome-scale metabolic networks of Escherichia coli, Saccharomyces cerevisiae and the diatom Phaeodactylum tricornutum. Whilst identified switch nodes may be biased because computed flux vectors satisfying given objectives are not necessarily unique, the proposed method has still a relevant predictive potential, complementing the current array of computational methods to study metabolism. References [1] Tao Yu, Yasaman Dabirian, Quanli Liu, Verena Siewers, Jens Nielsen (2019) Strategies and challenges for metabolic rewiring. Current Opinion in Systems Biology, Vol 15, pp 30-38. https://doi.org/10.1016/j.coisb.2019.03.004. [2] Francis Mairet (2024) In silico identification of switching nodes in metabolic networks. bioRxiv, ver.3 peer-reviewed and recommended by PCI Math Comp Biol https://doi.org/10.1101/2023.05.17.541195 | In silico identification of switching nodes in metabolic networks | Francis Mairet | <p>Cells modulate their metabolism according to environmental conditions. A major challenge to better understand metabolic regulation is to identify, from the hundreds or thousands of molecules, the key metabolites where the re-orientation of flux... |  | Graph theory, Physiology, Systems biology | Claudine Chaouiya | Anonymous | 2023-05-26 17:24:26 | View |
FOLLOW US
MANAGING BOARD
Wolfram Liebermeister
Celine Scornavacca (Representative)
Donate Weghorn


