
Latest recommendations
| Id | Title * | Authors * | Abstract * | Picture * | Thematic fields * | Recommender | Reviewers | Submission date | |
|---|---|---|---|---|---|---|---|---|---|
19 Sep 2022
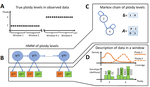
HMMploidy: inference of ploidy levels from short-read sequencing dataDetecting variation in ploidy within and between genomesRecommended by Alan Rogers based on reviews by Barbara Holland, Benjamin Peter and Nicolas Galtier based on reviews by Barbara Holland, Benjamin Peter and Nicolas Galtier
Soraggi et al. [2] describe HMMploidy, a statistical method that takes DNA sequencing data as input and uses a hidden Markov model to estimate ploidy. The method allows ploidy to vary not only between individuals, but also between and even within chromosomes. This allows the method to detect aneuploidy and also chromosomal regions in which multiple paralogous loci have been mistakenly assembled on top of one another. HMMploidy estimates genotypes and ploidy simultaneously, with a separate estimate for each genome. The genome is divided into a series of non-overlapping windows (typically 100), and HMMploidy provides a separate estimate of ploidy within each window of each genome. The method is thus estimating a large number of parameters, and one might assume that this would reduce its accuracy. However, it benefits from large samples of genomes. Large samples increase the accuracy of internal allele frequency estimates, and this improves the accuracy of genotype and ploidy estimates. In large samples of low-coverage genomes, HMMploidy outperforms all other estimators. It does not require a reference genome of known ploidy. The power of the method increases with coverage and sample size but decreases with ploidy. Consequently, high coverage or large samples may be needed if ploidy is high. The method is slower than some alternative methods, but run time is not excessive. Run time increases with number of windows but isn't otherwise affected by genome size. It should be feasible even with large genomes, provided that the number of windows is not too large. The authors apply their method and several alternatives to isolates of a pathogenic yeast, Cryptococcus neoformans, obtained from HIV-infected patients. With these data, HMMploidy replicated previous findings of polyploidy and aneuploidy. There were several surprises. For example, HMMploidy estimates the same ploidy in two isolates taken on different days from a single patient, even though sequencing coverage was three times as high on the later day as on the earlier one. These findings were replicated in data that were down-sampled to mimic low coverage. Three alternative methods (ploidyNGS [1], nQuire, and nQuire.Den [3]) estimated the highest ploidy considered in all samples from each patient. The present authors suggest that these results are artifactual and reflect the wide variation in allele frequencies. Because of this variation, these methods seem to have preferred the model with the largest number of parameters. HMMploidy represents a new and potentially useful tool for studying variation in ploidy. It will be of most use in studying the genetics of asexual organisms and cancers, where aneuploidy imposes little or no penalty on reproduction. It should also be useful for detecting assembly errors in de novo genome sequences from non-model organisms. References [1] Augusto Corrêa dos Santos R, Goldman GH, Riaño-Pachón DM (2017) ploidyNGS: visually exploring ploidy with Next Generation Sequencing data. Bioinformatics, 33, 2575–2576. https://doi.org/10.1093/bioinformatics/btx204 [2] Soraggi S, Rhodes J, Altinkaya I, Tarrant O, Balloux F, Fisher MC, Fumagalli M (2022) HMMploidy: inference of ploidy levels from short-read sequencing data. bioRxiv, 2021.06.29.450340, ver. 6 peer-reviewed and recommended by Peer Community in Mathematical and Computational Biology. https://doi.org/10.1101/2021.06.29.450340 [3] Weiß CL, Pais M, Cano LM, Kamoun S, Burbano HA (2018) nQuire: a statistical framework for ploidy estimation using next generation sequencing. BMC Bioinformatics, 19, 122. https://doi.org/10.1186/s12859-018-2128-z | HMMploidy: inference of ploidy levels from short-read sequencing data | Samuele Soraggi, Johanna Rhodes, Isin Altinkaya, Oliver Tarrant, Francois Balloux, Matthew C Fisher, Matteo Fumagalli | <p>The inference of ploidy levels from genomic data is important to understand molecular mechanisms underpinning genome evolution. However, current methods based on allele frequency and sequencing depth variation do not have power to infer ploidy ... | | Design and analysis of algorithms, Evolutionary Biology, Genetics and population Genetics, Probability and statistics | Alan Rogers | 2021-07-01 05:26:31 | ||
21 Feb 2022
Consistency of orthology and paralogy constraints in the presence of gene transfersAllowing gene transfers doesn't make life easier for inferring orthology and paralogyRecommended by Barbara Holland based on reviews by 2 anonymous reviewersDetermining if genes are orthologous (i.e. homologous genes whose most common ancestor represents a speciation) or paralogous (homologous genes whose most common ancestor represents a duplication) is a foundational problem in bioinformatics. For instance, the input to almost all phylogenetic methods is a sequence alignment of genes assumed to be orthologous. Understanding if genes are paralogs or orthologs can also be important for assigning function, for example genes that have diverged following duplication may be more likely to have neofunctionalised or subfunctionalised compared to genes that have diverged following speciation, which may be more likely to have continued in a similar role. This paper by Jones et al (2022) contributes to a wide range of literature addressing the inference of orthology/paralogy relations but takes a different approach to explaining inconsistency between an assumed species phylogeny and a relation graph (a graph where nodes represent genes and edges represent that the two genes are orthologs). Rather than assuming that inconsistencies are the result of incorrect assessment of orthology (i.e. incorrect edges in the relation graph) they ask if the relation graph could be consistent with a species tree combined with some amount of lateral (horizontal) gene transfer. The two main questions addressed in this paper are (1) if a network N and a relation graph R are consistent, and (2) if – given a species tree S and a relation graph R – transfer arcs can be added to S in such a way that it becomes consistent with R? The first question hinges on the concept of a reconciliation between a gene tree and a network (section 2.1) and amounts to asking if a gene tree can be found that can both be reconciled with the network and consistent with the relation graph. The authors show that the problem is NP hard. Furthermore, the related problem of attempting to find a solution using k or fewer transfers is NP-hard, and also W[1] hard implying that it is in a class of problems for which fixed parameter tractable solutions have not been found. The proof of NP hardness is by reduction to the k-multi-coloured clique problem via an intermediate problem dubbed “antichain on trees” (Section 3). The “antichain on trees” construction may be of interest to others working on algorithmic complexity with phylogenetic networks. In the second question the possible locations of transfers are not specified (or to put it differently any time consistent transfer arc is considered possible) and it is shown that it generally will be possible to add transfer edges to S in such a way that it can be consistent with R. However, the natural extension to this question of asking if it can be done with k or fewer added arcs is also NP hard. Many of the proofs in the paper are quite technical, but the authors have relegated a lot of this detail to the appendix thus ensuring that the main ideas and results are clear to follow in the main text. I am grateful to both reviewers for their detailed reviews and through checking of the proofs. References Jones M, Lafond M, Scornavacca C (2022) Consistency of orthology and paralogy constraints in the presence of gene transfers. arXiv:1705.01240 [cs], ver. 6 peer-reviewed and recommended by Peer Community in Mathematical and Computational Biology. https://arxiv.org/abs/1705.01240 | Consistency of orthology and paralogy constraints in the presence of gene transfers | Mark Jones, Manuel Lafond, Celine Scornavacca | <p style="text-align: justify;">Orthology and paralogy relations are often inferred by methods based on gene sequence similarity that yield a graph depicting the relationships between gene pairs. Such relation graphs frequently contain errors, as ... | | Computational complexity, Design and analysis of algorithms, Evolutionary Biology, Graph theory | Barbara Holland | 2021-06-30 15:01:44 | ||
04 Feb 2022
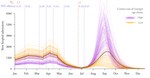
Non-Markovian modelling highlights the importance of age structure on Covid-19 epidemiological dynamicsImportance of age structure on modeling COVID-19 epidemiological dynamicsRecommended by Chen Liao based on reviews by Facundo Muñoz, Kevin Bonham and 1 anonymous reviewerCOVID-19 spread around the globe in early 2020 and has deeply changed our everyday life [1]. Mathematical models allow us to estimate R0 (basic reproduction number), understand the progression of viral infection, explore the impacts of quarantine on the epidemic, and most importantly, predict the future outbreak [2]. The most classical model is SIR, which describes time evolution of three variables, i.e., number of susceptible people (S), number of people infected (I), and number of people who have recovered (R), based on their transition rates [3]. Despite the simplicity, SIR model produces several general predictions that have important implications for public health [3]. SIR model includes three populations with distinct labels and is thus compartmentalized. Extra compartments can be added to describe additional states of populations, for example, people exposed to the virus but not yet infectious. However, a model with more compartments, though more realistic, is also more difficult to parameterize and analyze. The study by Reyné et al. [4] proposed an alternative formalism based on PDE (partial differential equation), which allows modeling different biological scenarios without the need of adding additional compartments. As illustrated, the authors modeled hospital admission dynamics in a vaccinated population only with 8 general compartments. The main conclusion of this study is that the vaccination level till 2021 summer was insufficient to prevent a new epidemic in France. Additionally, the authors used alternative data sources to estimate the age-structured contact patterns. By sensitivity analysis on a daily basis, they found that the 9 parameters in the age-structured contact matrix are most variable and thus shape Covid19 pandemic dynamics. This result highlights the importance of incorporating age structure of the host population in modeling infectious diseases. However, a relevant potential limitation is that the contact matrix was assumed to be constant throughout the simulations. To account for time dependence of the contact matrix, social and behavioral factors need to be integrated [5]. References [1] Hu B, Guo H, Zhou P, Shi Z-L (2021) Characteristics of SARS-CoV-2 and COVID-19. Nature Reviews Microbiology, 19, 141–154. https://doi.org/10.1038/s41579-020-00459-7 [2] Jinxing G, Yongyue W, Yang Z, Feng C (2020) Modeling the transmission dynamics of COVID-19 epidemic: a systematic review. The Journal of Biomedical Research, 34, 422–430. https://doi.org/10.7555/JBR.34.20200119 [3] Tolles J, Luong T (2020) Modeling Epidemics With Compartmental Models. JAMA, 323, 2515–2516. https://doi.org/10.1001/jama.2020.8420 [4] Reyné B, Richard Q, Noûs C, Selinger C, Sofonea MT, Djidjou-Demasse R, Alizon S (2022) Non-Markovian modelling highlights the importance of age structure on Covid-19 epidemiological dynamics. medRxiv, 2021.09.30.21264339, ver. 3 peer-reviewed and recommended by Peer Community in Mathematical and Computational Biology. https://doi.org/10.1101/2021.09.30.21264339 [5] Bedson J, Skrip LA, Pedi D, Abramowitz S, Carter S, Jalloh MF, Funk S, Gobat N, Giles-Vernick T, Chowell G, de Almeida JR, Elessawi R, Scarpino SV, Hammond RA, Briand S, Epstein JM, Hébert-Dufresne L, Althouse BM (2021) A review and agenda for integrated disease models including social and behavioural factors. Nature Human Behaviour, 5, 834–846 https://doi.org/10.1038/s41562-021-01136-2 | Non-Markovian modelling highlights the importance of age structure on Covid-19 epidemiological dynamics | Bastien Reyné, Quentin Richard, Camille Noûs, Christian Selinger, Mircea T. Sofonea, Ramsès Djidjou-Demasse, Samuel Alizon | <p style="text-align: justify;">The Covid-19 pandemic outbreak was followed by a huge amount of modelling studies in order to rapidly gain insights to implement the best public health policies. Most of these compartmental models involved ordinary ... | | Dynamical systems, Epidemiology, Systems biology | Chen Liao | 2021-10-04 13:49:51 | ||
13 Dec 2021
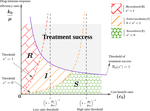
Within-host evolutionary dynamics of antimicrobial quantitative resistanceModelling within-host evolutionary dynamics of antimicrobial resistanceRecommended by Krasimira Tsaneva based on reviews by 2 anonymous reviewersAntimicrobial resistance (AMR) arises due to two main reasons: pathogens are either intrinsically resistant to the antimicrobials, or they can develop new resistance mechanisms in a continuous fashion over time and space. The latter has been referred to as within-host evolution of antimicrobial resistance and studied in infectious disease settings such as Tuberculosis [1]. During antibiotic treatment for example within-host evolutionary AMR dynamics plays an important role [2] and presents significant challenges in terms of optimizing treatment dosage. The study by Djidjou-Demasse et al. [3] contributes to addressing such challenges by developing a modelling approach that utilizes integro-differential equations to mathematically capture continuity in the space of the bacterial resistance levels. Given its importance as a major public health concern with enormous societal consequences around the world, the evolution of drug resistance in the context of various pathogens has been extensively studied using population genetics approaches [4]. This problem has been also addressed using mathematical modelling approaches including Ordinary Differential Equations (ODE)-based [5. 6] and more recently Stochastic Differential Equations (SDE)-based models [7]. In [3] the authors propose a model of within-host AMR evolution in the absence and presence of drug treatment. The advantage of the proposed modelling approach is that it allows for AMR to be represented as a continuous quantitative trait, describing the level of resistance of the bacterial population termed quantitative AMR (qAMR) in [3]. Moreover, consistent with recent experimental evidence [2] integro-differential equations take into account both, the dynamics of the bacterial population density, referred to as “bottleneck size” in [2] as well as the evolution of its level of resistance due to drug-induced selection. The model proposed in [3] has been extensively and rigorously analysed to address various scenarios including the significance of host immune response in drug efficiency, treatment failure and preventive strategies. The drug treatment chosen to be investigated in this study, namely chemotherapy, has been characterised in terms of the level of evolved resistance by the bacterial population in presence of antimicrobial pressure at equilibrium. Furthermore, the minimal duration of drug administration on bacterial growth and the emergence of AMR has been probed in the model by changing the initial population size and average resistance levels. A potential limitation of the proposed model is the assumption that mutations occur frequently (i.e. during growth), which may not be necessarily the case in certain experimental and/or clinical situations. References [1] Castro RAD, Borrell S, Gagneux S (2021) The within-host evolution of antimicrobial resistance in Mycobacterium tuberculosis. FEMS Microbiology Reviews, 45, fuaa071. https://doi.org/10.1093/femsre/fuaa071 [2] Mahrt N, Tietze A, Künzel S, Franzenburg S, Barbosa C, Jansen G, Schulenburg H (2021) Bottleneck size and selection level reproducibly impact evolution of antibiotic resistance. Nature Ecology & Evolution, 5, 1233–1242. https://doi.org/10.1038/s41559-021-01511-2 [3] Djidjou-Demasse R, Sofonea MT, Choisy M, Alizon S (2021) Within-host evolutionary dynamics of antimicrobial quantitative resistance. HAL, hal-03194023, ver. 4 peer-reviewed and recommended by Peer Community in Mathematical and Computational Biology. https://hal.archives-ouvertes.fr/hal-03194023 [4] Wilson BA, Garud NR, Feder AF, Assaf ZJ, Pennings PS (2016) The population genetics of drug resistance evolution in natural populations of viral, bacterial and eukaryotic pathogens. Molecular Ecology, 25, 42–66. https://doi.org/10.1111/mec.13474 [5] Blanquart F, Lehtinen S, Lipsitch M, Fraser C (2018) The evolution of antibiotic resistance in a structured host population. Journal of The Royal Society Interface, 15, 20180040. https://doi.org/10.1098/rsif.2018.0040 [6] Jacopin E, Lehtinen S, Débarre F, Blanquart F (2020) Factors favouring the evolution of multidrug resistance in bacteria. Journal of The Royal Society Interface, 17, 20200105. https://doi.org/10.1098/rsif.2020.0105 [7] Igler C, Rolff J, Regoes R (2021) Multi-step vs. single-step resistance evolution under different drugs, pharmacokinetics, and treatment regimens (BS Cooper, PJ Wittkopp, Eds,). eLife, 10, e64116. https://doi.org/10.7554/eLife.64116 | Within-host evolutionary dynamics of antimicrobial quantitative resistance | Ramsès Djidjou-Demasse, Mircea T. Sofonea, Marc Choisy, Samuel Alizon | <p style="text-align: justify;">Antimicrobial efficacy is traditionally described by a single value, the minimal inhibitory concentration (MIC), which is the lowest concentration that prevents visible growth of the bacterial population. As a conse... | | Dynamical systems, Epidemiology, Evolutionary Biology, Medical Sciences | Krasimira Tsaneva | 2021-04-16 16:55:19 | ||
07 Dec 2021
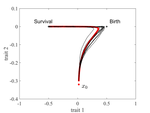
The emergence of a birth-dependent mutation rate in asexuals: causes and consequencesA new perspective in modeling mutation rate for phenotypically structured populationsRecommended by Yuan Lou based on reviews by Hirohisa Kishino and 1 anonymous reviewerIn standard mutation-selection models for describing the dynamics of phenotypically structured populations, it is often assumed that the mutation rate is constant across the phenotypes. In particular, this assumption leads to a constant diffusion coefficient for diffusion approximation models (Perthame, 2007 and references therein). Patout et al (2021) study the dependence of the mutation rate on the birth rate, by introducing some diffusion approximations at the population level, derived from the large population limit of a stochastic, individual-based model. The reaction-diffusion model in this article is of the “cross-diffusion” type: The form of “cross-diffusion” also appeared in ecological literature as a type of biased movement behaviors for organisms (Shigesada et al., 1979). The key underlying assumption for “cross-diffusion” is that the transition probability at the individual level depends solely upon the condition at the departure point. Patout et al (2021) envision that a higher birth rate yields more mutations per unit of time. One of their motivations is that during cancer development, the mutation rates of cancer cells at the population level could be correlated with reproduction success. The reaction-diffusion approximation model derived in this article illustrates several interesting phenomena: For the time evolution situation, their model predicts different solution trajectories under various assumptions on the fitness function, e.g. the trajectory could initially move towards the birth optimum but eventually end up at the survival optimum. Their model also predicts that the mean fitness could be flat for some period of time, which might provide another alternative to explain observed data. At the steady-state level, their model suggests that the populations are more concentrated around the survival optimum, which agrees with the evolution of the time-dependent solution trajectories. Perhaps one of the most interesting contributions of the study of Patout et al (2021) is to give us a new perspective to model the mutation rate in phenotypically structured populations and subsequently, and to help us better understand the connection between mutation and selection. More broadly, this article offers some new insights into the evolutionary dynamics of phenotypically structured populations, along with potential implications in empirical studies. References Perthame B (2007) Transport Equations in Biology Frontiers in Mathematics. Birkhäuser, Basel. https://doi.org/10.1007/978-3-7643-7842-4_2 Patout F, Forien R, Alfaro M, Papaïx J, Roques L (2021) The emergence of a birth-dependent mutation rate in asexuals: causes and consequences. bioRxiv, 2021.06.11.448026, ver. 3 peer-reviewed and recommended by Peer Community in Mathematical and Computational Biology. https://doi.org/10.1101/2021.06.11.448026 Shigesada N, Kawasaki K, Teramoto E (1979) Spatial segregation of interacting species. Journal of Theoretical Biology, 79, 83–99. https://doi.org/10.1016/0022-5193(79)90258-3 | The emergence of a birth-dependent mutation rate in asexuals: causes and consequences | Florian Patout, Raphaël Forien, Matthieu Alfaro, Julien Papaïx, Lionel Roques | <p style="text-align: justify;">In unicellular organisms such as bacteria and in most viruses, mutations mainly occur during reproduction. Thus, genotypes with a high birth rate should have a higher mutation rate. However, standard models of asexu... | | Dynamical systems, Evolutionary Biology, Probability and statistics, Stochastic dynamics | Yuan Lou | Anonymous, Hirohisa Kishino | 2021-06-12 13:59:45 | |
07 Sep 2021
The origin of the allometric scaling of lung ventilation in mammalsHow mammals adapt their breath to body activity – and how this depends on body sizeRecommended by Wolfram Liebermeister based on reviews by Elad Noor, Oliver Ebenhöh, Stefan Schuster and Megumi Inoue
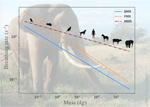
How fast and how deep do animals breathe, and how does this depend on how active they are? To answer this question, one needs to dig deeply into how breathing works and what biophysical processes it involves. And one needs to think about body size. It is impressive how nature adapts the same body plan – e.g. the skeletal structure of mammals – to various shapes and sizes. From mice to whales, also the functioning of most organs remains the same; they are just differently scaled. Scaling does not just mean “making bigger or smaller”. As already noted by Galilei, body shapes change as they are adapted to body dimensions, and the same holds for physiological variables. Many such variables, for instance, heartbeat rates, follow scaling laws of the form y~x^a, where x denotes body mass and the exponent a is typically a multiple of ¼ [1]. These unusual exponents – instead of multiples of ⅓, which would be expected from simple geometrical scaling – are why these laws are called “allometric”. Kleiber’s law for metabolic rates, with a scaling exponent of ¾, is a classic example [2]. As shown by G. West, allometric laws can be explained through a few simple steps [1]. In his models, he focused on network-like organs such as the vascular system and assumed that these systems show a self-similar structure, with a fixed minimal unit (for instance, capillaries) but varying numbers of hierarchy levels depending on body size. To determine the flow through such networks, he employed biophysical models and optimality principles (for instance, assuming that oxygen must be transported at a minimal mechanical effort), and showed that the solutions – and the physiological variables – respect the known scaling relations. The paper “The origin of the allometric scaling of lung ventilation in mammals“ by Noël et al. [3], applies this thinking to the depth and rate of breathing in mammals. Scaling laws describing breathing in resting animals have been known since the 1950s [4], with exponents of 1 (for tidal volume) and -¼ (for breathing frequency). Equipped with a detailed biophysical model, Noël et al. revisit this question, extending these laws to other metabolic regimes. Their starting point is a model of the human lung, developed previously by two of the authors [5], which assumes that we meet our oxygen demand with minimal lung movements. To state this as an optimization problem, the model combines two submodels: a mechanical model describing the energetic effort of ventilation and a highly detailed model of convection and diffusion in self-similar lung geometries. Breathing depths and rates are computed by numerical optimization, and to obtain results for mammals of any size many of the model parameters are described by known scaling laws. As expected, the depth of breathing (measured by tidal volume) scales almost proportionally with body mass and increases with metabolic demand, while the breathing rate decreases with body mass, with an exponent of about -¼. However, the laws for the breathing rate hold only for basal activity; at higher metabolic rates, which are modeled here for the first time, the exponent deviates strongly from this value, in line with empirical data. Why is this paper important? The authors present a highly complex model of lung physiology that integrates a wide range of biophysical details and passes a difficult test: the successful prediction of unexplained scaling exponents. These scaling relations may help us transfer insights from animal models to humans and in reverse: data for breathing during exercise, which are easy to measure in humans, can be extrapolated to other species. Aside from the scaling laws, the model also reveals physiological mechanisms. In the larger lung branches, oxygen is transported mainly by air movement (convection), while in smaller branches air flow is slow and oxygen moves by diffusion. The transition between these regimes can occur at different depths in the lung: as the authors state, “the localization of this transition determines how ventilation should be controlled to minimize its energetic cost at any metabolic regime”. In the model, the optimal location for the transition depends on oxygen demand [5, 6]: the transition occurs deeper in the lung in exercise regimes than at rest, allowing for more oxygen to be taken up. However, the effects of this shift depend on body size: while small mammals generally use the entire exchange surface of their lungs, large mammals keep a reserve for higher activities, which becomes accessible as their transition zone moves at high metabolic rates. Hence, scaling can entail qualitative differences between species! Altogether, the paper shows how the dynamics of ventilation depend on lung morphology. But this may also play out in the other direction: if energy-efficient ventilation depends on body activity, and therefore on ecological niches, a niche may put evolutionary pressures on lung geometry. Hence, by understanding how deep and fast animals breathe, we may also learn about how behavior, physiology, and anatomy co-evolve. References [1] West GB, Brown JH, Enquist BJ (1997) A General Model for the Origin of Allometric Scaling Laws in Biology. Science 276 (5309), 122–126. https://doi.org/10.1126/science.276.5309.122 [2] Kleiber M (1947) Body size and metabolic rate. Physiological Reviews, 27, 511–541. https://doi.org/10.1152/physrev.1947.27.4.511 [3] Noël F., Karamaoun C., Dempsey J. A. and Mauroy B. (2021) The origin of the allometric scaling of lung's ventilation in mammals. arXiv, 2005.12362, ver. 6 peer-reviewed and recommended by Peer community in Mathematical and Computational Biology. https://arxiv.org/abs/2005.12362 [4] Otis AB, Fenn WO, Rahn H (1950) Mechanics of Breathing in Man. Journal of Applied Physiology, 2, 592–607. https://doi.org/10.1152/jappl.1950.2.11.592 [5] Noël F, Mauroy B (2019) Interplay Between Optimal Ventilation and Gas Transport in a Model of the Human Lung. Frontiers in Physiology, 10, 488. https://doi.org/10.3389/fphys.2019.00488 [6] Sapoval B, Filoche M, Weibel ER (2002) Smaller is better—but not too small: A physical scale for the design of the mammalian pulmonary acinus. Proceedings of the National Academy of Sciences, 99, 10411–10416. https://doi.org/10.1073/pnas.122352499 | The origin of the allometric scaling of lung ventilation in mammals | Frédérique Noël, Cyril Karamaoun, Jerome A. Dempsey, Benjamin Mauroy | <p>A model of optimal control of ventilation has recently been developed for humans. This model highlights the importance of the localization of the transition between a convective and a diffusive transport of respiratory gas. This localization de... | | Biophysics, Evolutionary Biology, Physiology | Wolfram Liebermeister | 2020-08-28 15:18:03 | ||
27 Jul 2021
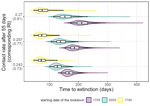
Estimating dates of origin and end of COVID-19 epidemicsThe importance of model assumptions in estimating the dynamics of the COVID-19 epidemicRecommended by Valery Forbes based on reviews by Bastien Boussau and 1 anonymous reviewerIn “Estimating dates of origin and end of COVID-19 epidemics”, Bénéteau et al. develop and apply a mathematical modeling approach to estimate the date of the origin of the SARS-CoV-2 epidemic in France. They also assess how long strict control measures need to last to ensure that the prevalence of the virus remains below key public health thresholds. This problem is challenging because the numbers of infected individuals in both tails of the epidemic are low, which can lead to errors when deterministic models are used. To achieve their goals, the authors developed a discrete stochastic model. The model is non-Markovian, meaning that individual infection histories influence the dynamics. The model also accounts for heterogeneity in the timing between infection and transmission and includes stochasticity as well as consideration of superspreader events. By comparing the outputs of their model with several alternative models, Bénéteau et al. were able to assess the importance of stochasticity, individual heterogeneity, and non-Markovian effects on the estimates of the dates of origin and end of the epidemic, using France as a test case. Some limitations of the study, which the authors acknowledge, are that the time from infection to death remains largely unknown, a lack of data on the heterogeneity of transmission among individuals, and the assumption that only a single infected individual caused the epidemic. Despite the acknowledged limitations of the work, the results suggest that cases may be detected long before the detection of an epidemic wave. Also, the approach may be helpful for informing public health decisions such as the necessary duration of strict lockdowns and for assessing the risks of epidemic rebound as restrictions are lifted. In particular, the authors found that estimates of the end of the epidemic following lockdowns are more sensitive to the assumptions of the models used than estimates of its beginning. In summary, this model adds to a valuable suite of tools to support decision-making in response to disease epidemics. References Bénéteau T, Elie B, Sofonea MT, Alizon S (2021) Estimating dates of origin and end of COVID-19 epidemics. medRxiv, 2021.01.19.21250080, ver. 3 peer-reviewed and recommended by Peer Community in Mathematical and Computational Biology. https://doi.org/10.1101/2021.01.19.21250080 | Estimating dates of origin and end of COVID-19 epidemics | Thomas Bénéteau, Baptiste Elie, Mircea T. Sofonea, Samuel Alizon | <p style="text-align: justify;">Estimating the date at which an epidemic started in a country and the date at which it can end depending on interventions intensity are important to guide public health responses. Both are potentially shaped by simi... | | Epidemiology, Probability and statistics, Stochastic dynamics | Valery Forbes | 2021-02-23 16:37:32 | ||
26 May 2021
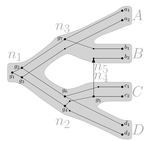
An efficient algorithm for estimating population history from genetic dataAn efficient implementation of legofit software to infer demographic histories from population genetic dataRecommended by Matteo Fumagalli based on reviews by Fernando Racimo and 1 anonymous reviewer
The estimation of demographic parameters from population genetic data has been the subject of many scientific studies [1]. Among these efforts, legofit was firstly proposed in 2019 as a tool to infer size changes, subdivision and gene flow events from patterns of nucleotidic variation [2]. The first release of legofit used a stochastic algorithm to fit population parameters to the observed data. As it requires simulations to evaluate the fitting of each model, it is computationally intensive and can only be deployed on high-performance computing clusters. To overcome this issue, Rogers proposes a new implementation of legofit based on a deterministic algorithm that allows the estimation of demographic histories to be computationally faster and more accurate [3]. The new algorithm employs a continuous-time Markov chain that traces the ancestry of each sample into the past. The calculations are now divided into two steps, the first one being solved numerically. To test the hypothesis that the new implementation of legofit produces a more desirable performance, Rogers generated extensive simulations of genomes from African, European, Neanderthal and Denisovan populations with msprime [4]. Additionally, legofit was tested on real genetic data from samples of said populations, following a previously published study [5]. Based on simulations, the new deterministic algorithm is more than 1600 times faster than the previous stochastic model. Notably, the new version of legofit produces smaller residual errors, although the overall accuracy to estimate population parameters is comparable to the one obtained using the stochastic algorithm. When applied to real data, the new implementation of legofit was able to recapitulate previous findings of a complex demographic model with early gene flow from humans to Neanderthal [5]. Notably, the new implementation generates better discrimination between models, therefore leading to a better precision at predicting the population history. Some parameters estimated from real data point towards unrealistic scenarios, suggesting that the initial model could be misspecified. Further research is needed to fully explore the parameter range that can be evaluated by legofit, and to clarify the source of any associated bias. Additionally, the inclusion of data uncertainty in parameter estimation and model selection may be required to apply legofit to low-coverage high-throughput sequencing data [6]. Nevertheless, legofit is an efficient, accessible and user-friendly software to infer demographic parameters from genetic data and can be widely applied to test hypotheses in evolutionary biology. The new implementation of legofit software is freely available at https://github.com/alanrogers/legofit. References [1] Spence JP, Steinrücken M, Terhorst J, Song YS (2018) Inference of population history using coalescent HMMs: review and outlook. Current Opinion in Genetics & Development, 53, 70–76. https://doi.org/10.1016/j.gde.2018.07.002 [2] Rogers AR (2019) Legofit: estimating population history from genetic data. BMC Bioinformatics, 20, 526. https://doi.org/10.1186/s12859-019-3154-1 [3] Rogers AR (2021) An Efficient Algorithm for Estimating Population History from Genetic Data. bioRxiv, 2021.01.23.427922, ver. 5 peer-reviewed and recommended by Peer community in Mathematical and Computational Biology. https://doi.org/10.1101/2021.01.23.427922 [4] Kelleher J, Etheridge AM, McVean G (2016) Efficient Coalescent Simulation and Genealogical Analysis for Large Sample Sizes. PLOS Computational Biology, 12, e1004842. https://doi.org/10.1371/journal.pcbi.1004842 [5] Rogers AR, Harris NS, Achenbach AA (2020) Neanderthal-Denisovan ancestors interbred with a distantly related hominin. Science Advances, 6, eaay5483. https://doi.org/10.1126/sciadv.aay5483 [6] Soraggi S, Wiuf C, Albrechtsen A (2018) Powerful Inference with the D-Statistic on Low-Coverage Whole-Genome Data. G3 Genes|Genomes|Genetics, 8, 551–566. https://doi.org/10.1534/g3.117.300192 | An efficient algorithm for estimating population history from genetic data | Alan R. Rogers | <p style="text-align: justify;">The Legofit statistical package uses genetic data to estimate parameters describing population history. Previous versions used computer simulations to estimate probabilities, an approach that limited both speed and ... | | Combinatorics, Genetics and population Genetics | Matteo Fumagalli | 2021-01-26 20:04:35 | ||
24 Dec 2020
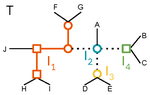
A linear time solution to the Labeled Robinson-Foulds Distance problemComparing reconciled gene trees in linear timeRecommended by Céline Scornavacca based on reviews by Barbara Holland, Gabriel Cardona, Jean-Baka Domelevo Entfellner and 1 anonymous reviewer
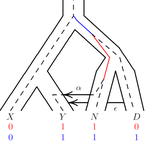
Unlike a species tree, a gene tree results not only from speciation events, but also from events acting at the gene level, such as duplications and losses of gene copies, and gene transfer events [1]. The reconciliation of phylogenetic trees consists in embedding a given gene tree into a known species tree and, doing so, determining the location of these gene-level events on the gene tree [2]. Reconciled gene trees can be seen as phylogenetic trees where internal node labels are used to discriminate between different gene-level events. Comparing them is of foremost importance in order to assess the performance of various reconciliation methods (e.g. [3]). References [1] Maddison, W. P. (1997). Gene trees in species trees. Systematic biology, 46(3), 523-536. doi: https://doi.org/10.1093/sysbio/46.3.523 | A linear time solution to the Labeled Robinson-Foulds Distance problem | Samuel Briand, Christophe Dessimoz, Nadia El-Mabrouk and Yannis Nevers | <p>Motivation Comparing trees is a basic task for many purposes, and especially in phylogeny where different tree reconstruction tools may lead to different trees, likely representing contradictory evolutionary information. While a large variety o... | | Combinatorics, Design and analysis of algorithms, Evolutionary Biology | Céline Scornavacca | 2020-08-20 21:06:23 | ||
09 Sep 2020
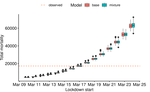
Bayesian investigation of SARS-CoV-2-related mortality in FranceModeling the effect of lockdown and other events on the dynamics of SARS-CoV-2 in FranceRecommended by Valery Forbes based on reviews by Wayne Landis and 1 anonymous reviewerThis study [1] used Bayesian models of the number of deaths through time across different regions of France to explore the effects of lockdown and other events (i.e., holding elections) on the dynamics of the SARS-CoV-2 epidemic. The models accurately predicted the number of deaths 2 to 3 weeks in advance, and results were similar to other recent models using different structure and input data. Viral reproduction numbers were not found to be different between weekends and week days, and there was no evidence that holding elections affected the number of deaths directly. However, exploring different scenarios of the timing of the lockdown showed that this had a substantial impact on the number of deaths. This is an interesting and important paper that can inform adaptive management strategies for controlling the spread of this virus, not just in France, but in other geographic areas. For example, the results found that there was a lag period between a change in management strategies (lockdown, social distancing, and the relaxing of controls) and the observed change in mortality. Also, there was a large variation in the impact of mitigation measures on the viral reproduction number depending on region, with lockdown being slightly more effective in denser regions. The authors provide an extensive amount of additional data and code as supplemental material, which increase the value of this contribution to the rapidly growing literature on SARS-CoV-2. References [1] Duchemin, L., Veber, P. and Boussau, B. (2020) Bayesian investigation of SARS-CoV-2-related mortality in France. medRxiv 2020.06.09.20126862, ver. 5 peer-reviewed and recommended by PCI Mathematical & Computational Biology. doi: 10.1101/2020.06.09.20126862 | Bayesian investigation of SARS-CoV-2-related mortality in France | Louis Duchemin, Philippe Veber, Bastien Boussau | <p>The SARS-CoV-2 epidemic in France has focused a lot of attention as it hashad one of the largest death tolls in Europe. It provides an opportunity to examine the effect of the lockdown and of other events on the dynamics of the epidemic. In par... | | Probability and statistics | Valery Forbes | 2020-07-08 17:29:46 |


