
Latest recommendations
| Id | Title * | Authors * | Abstract * | Picture * | Thematic fields * | Recommender | Reviewers | Submission date | |
|---|---|---|---|---|---|---|---|---|---|
25 Feb 2025
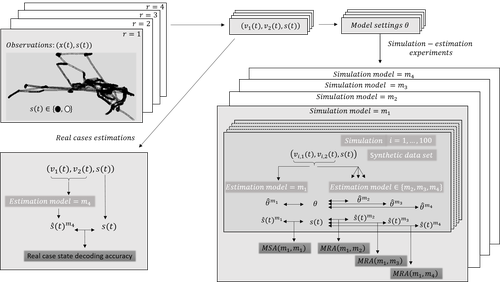
Proper account of auto-correlations improves decoding performances of state-space (semi) Markov modelsAn empirical study on the impact of neglecting dependencies in the observed or the hidden layer of a H(S)MM model on decoding performancesRecommended by Nathalie Peyrard based on reviews by Sandra Plancade and 1 anonymous reviewer based on reviews by Sandra Plancade and 1 anonymous reviewer
The article by Bez et al [1] addresses an important issue for statisticians and ecological modellers: the impact of modelling choices when considering state-space models to represent time series with hidden regimes. The authors present an empirical study of the impact of model misspecification for models in the HMM and HSMM family. The misspecification can be at the level of the hidden chain (Markovian or semi-Markovian assumption) or at the level of the observed chain (AR0 or AR1 assumption). The study uses data on the movements of fishing vessels. Vessels can exert pressure on fish stocks when they are fishing, and the aim is to identify the periods during which fishing vessels are fishing or not fishing, based on GPS tracking data. Two sets of data are available, from two vessels with contrasting fishing behaviour. The empirical study combines experiments on the two real datasets and on data simulated from models whose parameters are estimated on the real datasets. In both cases, the actual sequence of activities is available. The impact of a model misspecification is mainly evaluated on the restored hidden chain (decoding task), which is very relevant since in many applications we are more interested in the quality of decoding than in the accuracy of parameters estimation. Results on parameter estimation are also presented and metrics are developed to help interpret the results. The study is conducted in a rigorous manner and extensive experiments are carried out, making the results robust. The main conclusion of the study is that choosing the wrong AR model at the observed sequence level has more impact than choosing the wrong model at the hidden chain level. The article ends with an interesting discussion of this finding, in particular the impact of resolution on the quality of the decoding results. As the authors point out in this discussion, the results of this study are not limited to the application of GPS data to the activities of fishing vessels Beyond ecology, H(S)MMs are also widely used epidemiology, seismology, speech recognition, human activity recognition ... The conclusion of this study will therefore be useful in a wide range of applications. It is a warning that should encourage modellers to design their hidden Markov models carefully or to interpret their results cautiously. References [1] Nicolas Bez, Pierre Gloaguen, Marie-Pierre Etienne, Rocio Joo, Sophie Lanco, Etienne Rivot, Emily Walker, Mathieu Woillez, Stéphanie Mahévas (2024) Proper account of auto-correlations improves decoding performances of state-space (semi) Markov models. HAL, ver.3 peer-reviewed and recommended by PCI Math Comp Biol https://hal.science/hal-04547315v3 | Proper account of auto-correlations improves decoding performances of state-space (semi) Markov models | Nicolas Bez, Pierre Gloaguen, Marie-Pierre Etienne, Rocio Joo, Sophie Lanco, Etienne Rivot, Emily Walker, Mathieu Woillez, Stéphanie Mahévas | <p>State-space models are widely used in ecology to infer hidden behaviors. This study develops an extensive numerical simulation-estimation experiment to evaluate the state decoding accuracy of four simple state-space models. These models are obt... | | Dynamical systems, Ecology, Probability and statistics | Nathalie Peyrard | 2024-05-29 16:29:25 | ||
27 Jan 2025
Biology-Informed inverse problems for insect pests detection using pheromone sensorsTowards accurate inference of insect presence landscapes from pheromone sensor networksRecommended by Eric Tannier based on reviews by Angelo Iollo and 1 anonymous reviewer
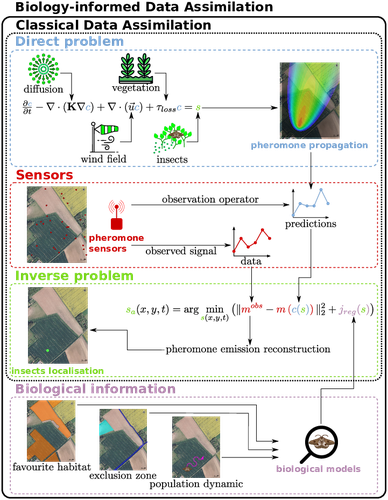
Insecticides are used to control crop pests and prevent severe crop losses. They are also a major cause of the current decline in biodiversity, contribute to climate change, and pollute soil and water, with consequences for human and environmental health [1]. The rationale behind the work of Malou et al [2] is that some pesticide application protocols can be improved by a better knowledge of the insects, their biology, their ecology and their real-time infestation dynamics in the fields. Thanks to a network of pheromone sensors and a mathematical method to derive the spatio-temporal distribution of pest populations from the signals, it is theoretically possible to adjust the time, dose and area of treatment and to use less pesticide with greater efficiency than an uninformed protocol. Malou et al [2] focus on the mathematical problem, recognising that its real role in pest control would require work on its implementation and on a benefit-harm analysis. The problem is an "inverse problem" [3] in that it consists of inferring the presence of insects from the trail left by the pheromones, given a model of pheromone diffusion by insects. The main contribution of this work is the formulation and comparison of different regularisation terms in the optimisation inference scheme, in order to guide the optimisation by biological knowledge of specific pests, such as some parameters of population dynamics. The accuracy and precision of the results are tested and compared on a simple toy example to test the ability of the model and algorithm to detect the source of the pheromones and the efficiency of the data assimilation principle. A further simulation is then carried out on a real plot with realistic parameters and rules based on knowledge of a maize pest. A repositioning of the sensors (informed by the results from the initial positions) is carried out during the test phase to allow better detection. The work of Malou et al [2] is large, deep and complete. Its includes a detailed study of the numerical solutions of different data assimilation methods, as well as a theoretical reflection on how this work could contribute to agricultural and environmental issues. References [1] IPBES (2024). Thematic Assessment Report on the Underlying Causes of Biodiversity Loss and the Determinants of Transformative Change and Options for Achieving the 2050 Vision for Biodiversity of the Intergovernmental Science-Policy Platform on Biodiversity and Ecosystem Services. O’Brien, K., Garibaldi, L., and Agrawal, A. (eds.). IPBES secretariat, Bonn, Germany. https://doi.org/10.5281/zenodo.11382215 [2] Thibault Malou, Nicolas Parisey, Katarzyna Adamczyk-Chauvat, Elisabeta Vergu, Béatrice Laroche, Paul-Andre Calatayud, Philippe Lucas, Simon Labarthe (2025) Biology-Informed inverse problems for insect pests detection using pheromone sensors. HAL, ver.2 peer-reviewed and recommended by PCI Math Comp Biol https://hal.inrae.fr/hal-04572831v2 [3] Isakov V (2017). Inverse Problems for Partial Differential Equations. Vol. 127. Applied Mathematical Sciences. Cham: Springer International Publishing. https://doi.org/10.1007/978-3-319-51658-5. | Biology-Informed inverse problems for insect pests detection using pheromone sensors | Thibault Malou, Nicolas Parisey, Katarzyna Adamczyk-Chauvat, Elisabeta Vergu, Béatrice Laroche, Paul-Andre Calatayud, Philippe Lucas, Simon Labarthe | <p>Most insects have the ability to modify the odor landscape in order to communicate with their conspecies during key phases of their life cycle such as reproduction. They release pheromones in their nearby environment, volatile compounds that ar... | | Agricultural Science, Dynamical systems, Epidemiology, Systems biology | Eric Tannier | 2024-05-12 19:14:34 | ||
08 Nov 2024
Bayesian joint-regression analysis of unbalanced series of on-farm trialsHandling Data Imbalance and G×E Interactions in On-Farm Trials Using Bayesian Hierarchical ModelsRecommended by Sophie Donnet based on reviews by Pierre Druilhet and David Makowski
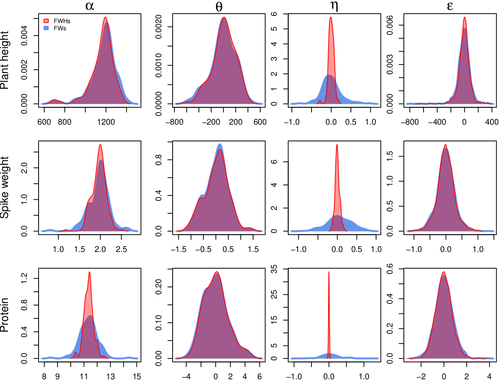
The article, "Bayesian Joint-Regression Analysis of Unbalanced Series of On-Farm Trials," presents a Bayesian statistical framework tailored for analyzing highly unbalanced datasets from participatory plant breeding (PPB) trials, specifically wheat trials. The key goal of this research is to address the challenges of genotype-environment (G×E) interactions in on-farm trials, which often have limited replication and varied testing conditions across farms. The study applies a hierarchical Bayesian model with Finlay-Wilkinson regression, which improves the estimation of G×E effects despite substantial data imbalance. By incorporating a Student’s t-distribution for residuals, the model is more robust to extreme values, which are common in on-farm trials due to variable environments. Note that the model allows a detailed breakdown of variance, identifying environment effects as the most significant contributors, thus highlighting areas for future breeding focus. Using Hamiltonian Monte Carlo methods, the study achieves reasonable computation times, even for large datasets. Obviously, the limitation of the methods comes from the level of data balance and replication. The method requires a minimum level of data balance and replication, which can be a challenge in very decentralized breeding networks Moreover, the Bayesian framework, though computationally feasible, may still be complex for widespread adoption without computational resources or statistical expertise. The paper presents a sophisticated Bayesian framework specifically designed to tackle the challenges of unbalanced data in participatory plant breeding (PPB). It showcases a novel way to manage the variability in on-farm trials, a common issue in decentralized breeding programs. This study's methods accommodate the inconsistencies inherent in on-farm trials, such as extreme values and minimal replication. By using a hierarchical Bayesian approach with a Student’s t-distribution for robustness, it provides a model that maintains precision despite these real-world challenges. This makes it especially relevant for those working in unpredictable agricultural settings or decentralized trials. From a more general perspective, this paper’s findings support breeding methods that prioritize specific adaptation to local conditions. It is particularly useful for researchers and practitioners interested in breeding for agroecological or organic farming systems, where G×E interactions are critical but hard to capture in traditional trial setups. Beyond agriculture, the paper serves as an excellent example of advanced statistical modeling in highly variable datasets. Its applications extend to any field where data is incomplete or irregular, offering a clear case for hierarchical Bayesian methods to achieve reliable results. Finally, although begin quite methodological, the paper provides practical insights into how breeders and researchers can work with farmers to achieve meaningful varietal evaluations. References Michel Turbet Delof , Pierre Rivière , Julie C Dawson, Arnaud Gauffreteau , Isabelle Goldringer , Gaëlle van Frank , Olivier David (2024) Bayesian joint-regression analysis of unbalanced series of on-farm trials. HAL, ver.2 peer-reviewed and recommended by PCI Math Comp Biol https://hal.science/hal-04380787 | Bayesian joint-regression analysis of unbalanced series of on-farm trials | Michel Turbet Delof , Pierre Rivière , Julie C Dawson, Arnaud Gauffreteau , Isabelle Goldringer , Gaëlle van Frank , Olivier David | <p>Participatory plant breeding (PPB) is aimed at developing varieties adapted to agroecologically-based systems. In PPB, selection is decentralized in the target environments, and relies on collaboration between farmers, farmers' organisations an... | | Agricultural Science, Genetics and population Genetics, Probability and statistics | Sophie Donnet | Pierre Druilhet, David Makowski | 2024-01-11 14:17:41 | |
21 Oct 2024
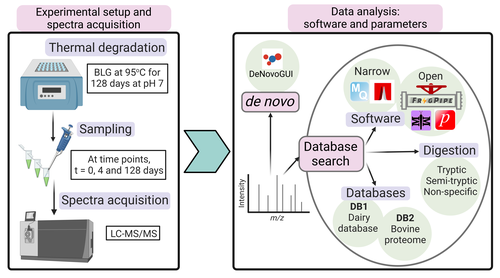
Benchmarking the identification of a single degraded protein to explore optimal search strategies for ancient proteinsSystematic investigation of software tools and design of a tailored pipeline for paleoproteomics researchRecommended by Raquel Assis based on reviews by Shevan Wilkin and 1 anonymous reviewerPaleoproteomics is a rapidly growing field with numerous challenges, many of which are due to the highly fragmented, modified, and degraded nature of ancient proteins. Though there are established standards for analysis, it is unclear how different software tools affect the identification and quantification of peptides, proteins, and post-translational modifications. To address this knowledge gap, Rodriguez Palomo et al. design a controlled system by experimentally degrading and purifying bovine beta-lactoglobulin, and then systematically compare the performance of many commonly used tools in its analysis. They present comprehensive investigations of false discovery rates, open and narrow searches, de novo sequencing coverage bias and accuracy, and peptide chemical properties and bias. In each investigation, they explore wide ranges of appropriate tools and parameters, providing guidelines and recommendations for best practices. Based on their findings, Rodriguez Palomo et al. develop a proposed pipeline that is tailored for the analysis of ancient proteins. This pipeline is an important contribution to paleoproteomics and is likely to be of great value to the research community, as it is designed to enhance power, accuracy, and consistency in studies of ancient proteins. References Ismael Rodriguez-Palomo, Bharath Nair, Yun Chiang, Joannes Dekker, Benjamin Dartigues, Meaghan Mackie, Miranda Evans, Ruairidh Macleod, Jesper V. Olsen, Matthew J. Collins (2023) Benchmarking the identification of a single degraded protein to explore optimal search strategies for ancient proteins. bioRxiv, ver.3 peer-reviewed and recommended by PCI Math Comp Biol https://doi.org/10.1101/2023.12.15.571577 | Benchmarking the identification of a single degraded protein to explore optimal search strategies for ancient proteins | Ismael Rodriguez-Palomo, Bharath Nair, Yun Chiang, Joannes Dekker, Benjamin Dartigues, Meaghan Mackie, Miranda Evans, Ruairidh Macleod, Jesper V. Olsen, Matthew J. Collins | <p style="text-align: justify;">Palaeoproteomics is a rapidly evolving discipline, and practitioners are constantly developing novel strategies for the analyses and interpretations of complex, degraded protein mixtures. The community has also esta... | | Genomics and Transcriptomics, Probability and statistics | Raquel Assis | Anonymous, Shevan Wilkin | 2024-03-12 15:17:08 | |
02 Oct 2024
HairSplitter: haplotype assembly from long, noisy readsAccurate Haplotype Reconstruction from Long, Error-Prone, Reads with HairSplitterRecommended by Giulio Ermanno Pibiri based on reviews by Dmitry Antipov and 1 anonymous reviewer
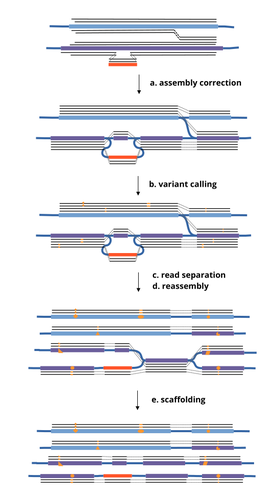
A prominent challenge in computational biology is to distinguish microbial haplotypes -- closely related organisms with highly similar genomes -- due to small genomic differences that can cause significant phenotypic variations. Current genome assembly tools struggle with distinguishing these haplotypes, especially for long-read sequencing data with high error rates, such as PacBio or Oxford Nanopore Technology (ONT) reads. While existing methods work well for either viral or bacterial haplotypes, they often fail with low-abundance haplotypes and are computationally intensive. This work by Faure, Lavenier, and Flot [1] introduces a new tool -- HairSplitter -- that offers a solution for both viral and bacterial haplotype separation, even with error-prone long reads. It does this by efficiently calling variants, clustering reads into haplotypes, creating new separated contigs, and resolving the assembly graph. A key advantage of HairSplitter is that it is entirely parameter-free and does not require prior knowledge of the organism's ploidy. HairSplitter is designed to handle both metaviromes and bacterial metagenomes, offering a more versatile and efficient solution than existing tools, like stRainy [2], Strainberry [3], and hifiasm-meta [4]. References [1] Roland Faure, Dominique Lavenier, Jean-François Flot (2024) HairSplitter: haplotype assembly from long, noisy reads. bioRxiv, ver.3 peer-reviewed and recommended by PCI Math Comp Biol https://doi.org/10.1101/2024.02.13.580067 [2] Kazantseva E, A Donmez, M Pop, and M Kolmogorov (2023). stRainy: assembly-based metagenomic strain phasing using long reads. Bioinformatics. https://doi.org/10.1101/2023.01.31.526521 [3] Vicedomini R, C Quince, AE Darling, and R Chikhi (2021). Strainberry: automated strain separation in low complexity metagenomes using long reads. Nature Communications, 12, 4485. ISSN: 2041-1723. https://doi.org/10.1038/s41467-021-24515-9 [4] Feng X, H Cheng, D Portik, and H Li (2022). Metagenome assembly of high-fidelity long reads with hifiasm-meta. Nature Methods, 19, 1–4. https://doi.org/10.1038/s41592-022-01478-3 | HairSplitter: haplotype assembly from long, noisy reads | Roland Faure, Dominique Lavenier, Jean-François Flot | <p>Long-read assemblers face challenges in discerning closely related viral or<br>bacterial strains, often collapsing similar strains in a single sequence. This limitation has<br>been hampering metagenome analysis, where diverse strains may harbor... | | Design and analysis of algorithms, Development, Genomics and Transcriptomics, Probability and statistics | Giulio Ermanno Pibiri | 2024-02-15 10:17:04 | ||
27 Sep 2024
In silico identification of switching nodes in metabolic networksA computational method to identify key players in metabolic rewiringRecommended by Claudine Chaouiya based on reviews by 2 anonymous reviewers
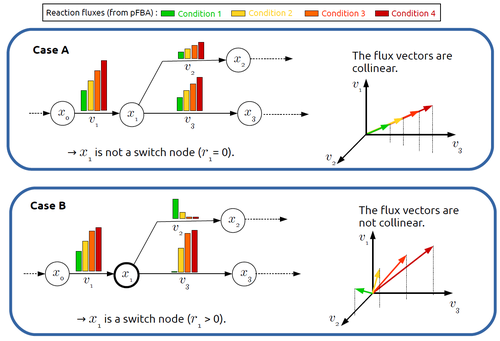
Significant progress has been made in developing computational methods to tackle the analysis of the numerous (genome-wide scale) metabolic networks that have been documented for a wide range of species. Understanding the behaviours of these complex reaction networks is crucial in various domains such as biotechnology and medicine. Metabolic rewiring is essential as it enables cells to adapt their metabolism to changing environmental conditions. Identifying the metabolites around which metabolic rewiring occurs is certainly useful in the case of metabolic engineering, which relies on metabolic rewiring to transform micro-organisms into cellular factories [1], as well as in other contexts. This paper by F. Mairet [2] introduces a method to disclose these metabolites, named switch nodes, relying on the analysis of the flux distributions for different input conditions. Basically, considering fluxes for different inputs, which can be computed using e.g. Parsimonious Flux Balance Analysis (pFBA), the proposed method consists in identifying metabolites involved in reactions whose different flux vectors are not collinear. The approach is supported by four case studies, considering core and genome-scale metabolic networks of Escherichia coli, Saccharomyces cerevisiae and the diatom Phaeodactylum tricornutum. Whilst identified switch nodes may be biased because computed flux vectors satisfying given objectives are not necessarily unique, the proposed method has still a relevant predictive potential, complementing the current array of computational methods to study metabolism. References [1] Tao Yu, Yasaman Dabirian, Quanli Liu, Verena Siewers, Jens Nielsen (2019) Strategies and challenges for metabolic rewiring. Current Opinion in Systems Biology, Vol 15, pp 30-38. https://doi.org/10.1016/j.coisb.2019.03.004. [2] Francis Mairet (2024) In silico identification of switching nodes in metabolic networks. bioRxiv, ver.3 peer-reviewed and recommended by PCI Math Comp Biol https://doi.org/10.1101/2023.05.17.541195 | In silico identification of switching nodes in metabolic networks | Francis Mairet | <p>Cells modulate their metabolism according to environmental conditions. A major challenge to better understand metabolic regulation is to identify, from the hundreds or thousands of molecules, the key metabolites where the re-orientation of flux... | | Graph theory, Physiology, Systems biology | Claudine Chaouiya | Anonymous | 2023-05-26 17:24:26 | |
27 Aug 2024
Impact of a block structure on the Lotka-Volterra modelEqulibrium of communities in the Lotka-Volterra modelRecommended by Loïc Paulevé based on reviews by 3 anonymous reviewers
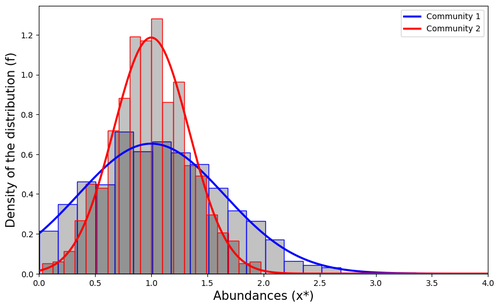
This article by Clenet et al. [1] tackles a fundamental mathematical model in ecology to understand the impact of the architecture of interactions on the equilibrium of the system. The authors consider the classical Lotka-Volterra model, depicting the effect of interactions between species on their abundances. They focus on the case whenever there are numerous species, and where their interactions are compartmentalized in a block structure. Each block has a strength coefficient, applied to a random Gaussian matrix. This model aims at capturing the structure of interacting communities, with blocks describing the interactions within a community, and other blocks the interactions between communities. In this general mathematical framework, the authors demonstrate sufficient conditions for the existence and uniqueness of a stable equilibrium, and conditions for which the equilibrium is feasible. Moreover, they derive statistical heuristics for the proportion, mean, and distribution of abundance of surviving species. Overall, the article constitutes an original and solid contribution to the study of mathematical models in ecology. It combines mathematical analysis, dynamical system theory, numerical simulations, grounded with relevant hypothesis for the modeling of ecological systems. References [1] Maxime Clenet, François Massol, Jamal Najim (2023) Impact of a block structure on the Lotka-Volterra model. arXiv, ver.3 peer-reviewed and recommended by Peer Community in Mathematical and Computational Biology. https://doi.org/10.48550/arXiv.2311.09470 | Impact of a block structure on the Lotka-Volterra model | Maxime Clenet, François Massol, Jamal Najim | <p>The Lotka-Volterra (LV) model is a simple, robust, and versatile model used to describe large interacting systems such as food webs or microbiomes. The model consists of $n$ coupled differential equations linking the abundances of $n$ differen... | | Dynamical systems, Ecology, Probability and statistics | Loïc Paulevé | 2023-11-17 21:44:38 | ||
13 Aug 2024
Phenotype control and elimination of variables in Boolean networksDisclosing effects of Boolean network reduction on dynamical properties and control strategiesRecommended by Claudine Chaouiya based on reviews by Tomas Gedeon and David Safranek
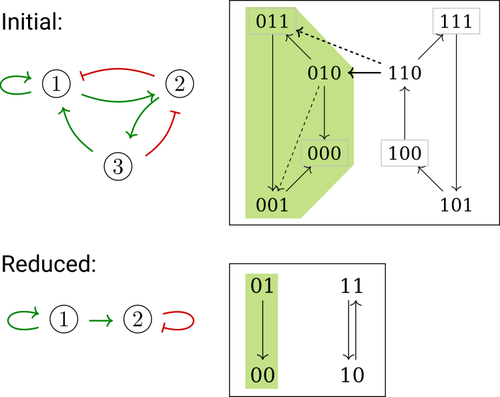
Boolean networks stem from seminal work by M. Sugita [1], S. Kauffman [2] and R. Thomas [3] over half a century ago. Since then, a very active field of research has been developed, leading to theoretical advances accompanied by a wealth of work on modelling genetic and signalling networks involved in a wide range of cellular processes. Boolean networks provide a successful formalism for the mathematical modelling of biological processes, with a qualitative abstraction particularly well adapted to handle the modelling of processes for which precise, quantitative data is barely available. Nevertheless, these abstract models reveal fundamental dynamical properties, such as the existence and reachability of attractors, which embody stable cellular responses (e.g. differentiated states). Analysing these properties still faces serious computational complexity. Reduction of model size was proposed as a mean to cope with this issue. Furthermore, to enhance the capacity of Boolean networks to produce relevant predictions, formal methods have been developed to systematically identify control strategies enforcing desired behaviours. In their paper, E. Tonello and L. Paulevé [4] assess the most popular reduction that consists in eliminating a model component. Considering three typical update schemes (synchronous, asynchronous and general asynchronous updates), they thoroughly study the effects of the reduction on attractors, minimal trap spaces (minimal subspaces from which the model dynamics cannot leave), and on phenotype controls (interventions which guarantee that the dynamics ends in a phenotype defined by specific component values). Because they embody potential behaviours of the biological process under study, these are all properties of great interest for a modeller. The authors show that eliminating a component can significantly affect some dynamical properties and may turn a control strategy ineffective. The different update schemes, targets of phenotype control and control strategies are carefully handled with useful supporting examples. Overall, E. Tonello and L. Paulevé’s contribution underlines the need for caution when defining a regulatory network and characterises the consequences on critical model properties when discarding a component [4]. References [1] Motoyosi Sugita (1963) Functional analysis of chemical systems in vivo using a logical circuit equivalent. II. The idea of a molecular automation. Journal of Theoretical Biology, 4, 179–92. https://doi.org/10.1016/0022-5193(63)90027-4 [2] Stuart Kauffman (1969) Metabolic stability and epigenesis in randomly constructed genetic nets. Journal of Theoretical Biology, 22, 437–67. https://doi.org/10.1016/0022-5193(69)90015-0 [3] René Thomas (1973) Boolean formalization of genetic control circuits. Journal of Theoretical Biology, 42, 563–85. https://doi.org/10.1016/0022-5193(73)90247-6 [4] Elisa Tonello, Loïc Paulevé (2024) Phenotype control and elimination of variables in Boolean networks. arXiv, ver.2 peer-reviewed and recommended by PCI Math Comp Biol https://arxiv.org/abs/2406.02304 | Phenotype control and elimination of variables in Boolean networks | Elisa Tonello, Loïc Paulevé | <p>We investigate how elimination of variables can affect the asymptotic dynamics and phenotype control of Boolean networks. In particular, we look at the impact on minimal trap spaces, and identify a structural condition that guarantees their pre... | | Dynamical systems, Systems biology | Claudine Chaouiya | 2024-06-05 10:12:39 | ||
23 Jul 2024
Alignment-free detection and seed-based identification of multi-loci V(D)J recombinations in Vidjil-algoAn accelerated Vidjil algorithm: up to 30X faster identification of V(D)J recombinations via spaced seeds and Aho-Corasick pattern matchingRecommended by Giulio Ermanno Pibiri based on reviews by Sven Rahmann and 1 anonymous reviewer
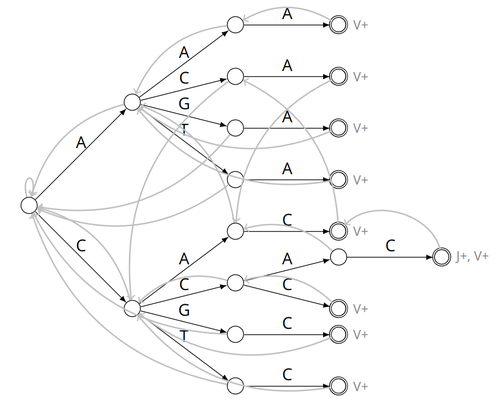
VDJ recombination is a crucial process in the immune system, where a V (variable) gene, a D (diversity) gene, and a J (joining) gene are randomly combined to create unique antigen receptor genes. This process generates a vast diversity of antibodies and T-cell receptors, essential for recognizing and combating a wide array of pathogens. By identifying and quantifying these VDJ recombinations, we can gain a deeper and more precise understanding of the immune response, enhancing our ability to monitor and manage immune-related conditions. It is therefore important to develop efficient methods to identify and extract VDJ recombinations from large sequences (e.g., several millions/billions of nucleotides). The work by Borée, Giraud, and Salson [2] contributes one such algorithm. As in previous work, the proposed algorithm employs the Aho-Corasick automaton to simultaneously match several patterns against a string but, differently from other methods, it also combines the efficiency of spaced seeds. Working with seeds rather than the original string has the net benefit of speeding up the algorithm and reducing its memory usage, sometimes at the price of a modest loss in accuracy. Experiments conducted on five different datasets demonstrate that these features grant the proposed method excellent practical performance compared to the best previous methods, like Vidjil [3] (up to 5X faster) and MiXCR [1] (up to 30X faster), with no quality loss. The method can also be considered an excellent example of a more general trend in scalable algorithmic design: adapt "classic" algorithms (in this case, the Aho-Corasick pattern matching algorithm) to work in sketch space (e.g., the spaced seeds used here), trading accuracy for efficiency. Sometimes, this compromise is necessary for the sake of scaling to very large datasets using modest computing power. References [1] D. A. Bolotin, S. Poslavsky, I. Mitrophanov, M. Shugay, I. Z. Mamedov, E. V. Putintseva, and D. M. Chudakov (2015). "MiXCR: software for comprehensive adaptive immunity profiling." Nature Methods 12, 380–381. ISSN: 1548-7091. https://doi.org/10.1038/nmeth.3364 [2] C. Borée, M. Giraud, M. Salson (2024) "Alignment-free detection and seed-based identification of multi-loci V(D)J recombinations in Vidjil-algo". https://hal.science/hal-04361907v2, version 2, peer-reviewed and recommended by Peer Community In Mathematical and Computational Biology. [3] M. Giraud, M. Salson, M. Duez, C. Villenet, S. Quief, A. Caillault, N. Grardel, C. Roumier, C. Preudhomme, and M. Figeac (2014). "Fast multiclonal clusterization of V(D)J recombinations from high-throughput sequencing". BMC Genomics 15, 409. https://doi.org/10.1186/1471-2164-15-409. | Alignment-free detection and seed-based identification of multi-loci V(D)J recombinations in Vidjil-algo | Cyprien Borée, Mathieu Giraud, Mikaël Salson | <p>The diversity of the immune repertoire is grounded on V(D)J recombinations in several loci. Many algorithms and software detect and designate these recombinations in high-throughput sequencing data. To improve their efficiency, we propose a mul... | | Combinatorics, Computational complexity, Design and analysis of algorithms, Genomics and Transcriptomics, Immunology | Giulio Ermanno Pibiri | 2023-12-28 18:03:42 | ||
22 Jul 2024
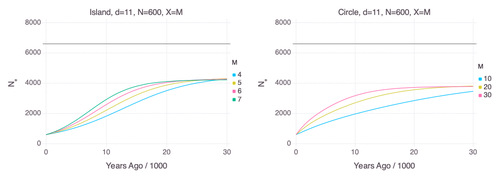
Genetic Evidence for Geographic Structure within the Neanderthal PopulationDecline in Neanderthal effective population size due to geographic structure and gene flowRecommended by Raquel Assis based on reviews by David Bryant and Guillaume AchazPublished PSMC estimates of Neanderthal effective population size (𝑁e) show an approximately five-fold decline over the past 20,000 years [1]. This observation may be attributed to a true decline in Neanderthal 𝑁e, statistical error that is notorious with PSMC estimation, or geographic subdivision and gene flow that has been hypothesized to occur within the Neanderthal population. Determining which of these factors contributes to the observed decline in Neanderthal 𝑁e is an important question that can provide insight into human evolutionary history. Though it is widely believed that the decline in Neanderthal 𝑁e is due to geographic subdivision and gene flow, no prior studies have theoretically examined whether these evolutionary processes can yield the observed pattern. In this paper [2], Rogers tackles this problem by employing two mathematical models to explore the roles of geographic subdivision and gene flow in the Neanderthal population. Results from both models show that geographic subdivision and gene flow can indeed result in a decline in 𝑁e that mirrors the observed decline estimated from empirical data. In contrast, Rogers argues that neither statistical error in PSMC estimates nor a true decline in 𝑁e are expected to produce the consistent decline in estimated 𝑁e observed across three distinct Neanderthal fossils. Statistical error would likely result in variation among these curves, whereas a true decline in 𝑁e would produce shifted curves due to the different ages of the three Neanderthal fossils. In summary, Rogers provides convincing evidence that the most reasonable explanation for the observed decline in Neanderthal 𝑁e is geographic subdivision and gene flow. Rogers also provides a basis for understanding this observation, suggesting that 𝑁e declines over time because coalescence times are shorter between more recent ancestors, as they are more likely to be geographic neighbors. Hence, Rogers’ theoretical findings shed light on an interesting aspect of human evolutionary history. References [1] Fabrizio Mafessoni, Steffi Grote, Cesare de Filippo, Svante Pääbo (2020) “A high-coverage Neandertal genome from Chagyrskaya Cave”. Proceedings of the National Academy of Sciences USA 117: 15132- 15136. https://doi.org/10.1073/pnas.2004944117 [2] Alan Rogers (2024) “Genetic evidence for geographic structure within the Neanderthal population”. bioRxiv, version 4 peer-reviewed and recommended by Peer Community in Mathematical and Computational Biology. https://doi.org/10.1101/2023.07.28.551046 | Genetic Evidence for Geographic Structure within the Neanderthal Population | Alan R. Rogers | <p>PSMC estimates of Neanderthal effective population size (N<sub>e</sub>)exhibit a roughly 5-fold decline across the most recent 20 ky before the death of each fossil. To explain this pattern, this article develops new theory relating... | | Evolutionary Biology, Genetics and population Genetics | Raquel Assis | 2023-10-17 18:06:38 |


